17. View usage and control cost
Full-length chapter. Content is checked against the 2026.10 mainline code and the live console; menus and features depend on the current license, account permissions, and delivered environment.
Back to overview · Full table of contents · Download full PDF
This chapter: for platform administrators, operations staff who own spend, and members who need to check their own consumption. After you finish it you can do four things: in 「Operations overview」, find which models, departments, members, and access credentials the money went to; say who tokens and cost are attributed to, and why some calls cannot be attributed; split cost to a business scenario and the end user with tags and end-user identifiers; stop the money at call time with quotas. Item-by-item allocation and pricing snapshots are in Chapter 18.
17.1 Read spend rankings and high-spend credentials
When to use this: at month-start review or when spend grows abnormally, first answer 「where did the money mainly go, and which key is running volume」.
Prerequisites: the account is a tenant administrator, or has an observability or finance role. Models are priced at the model provider (Chapter 5). Unpriced calls still count toward count and tokens; amount is recorded as 0.
Procedure
- Open 「Admin Console › Observability › Operations overview」. The 「Overview」 tab opens by default. In the toolbar, choose a time range (default 「Last 7 days」).
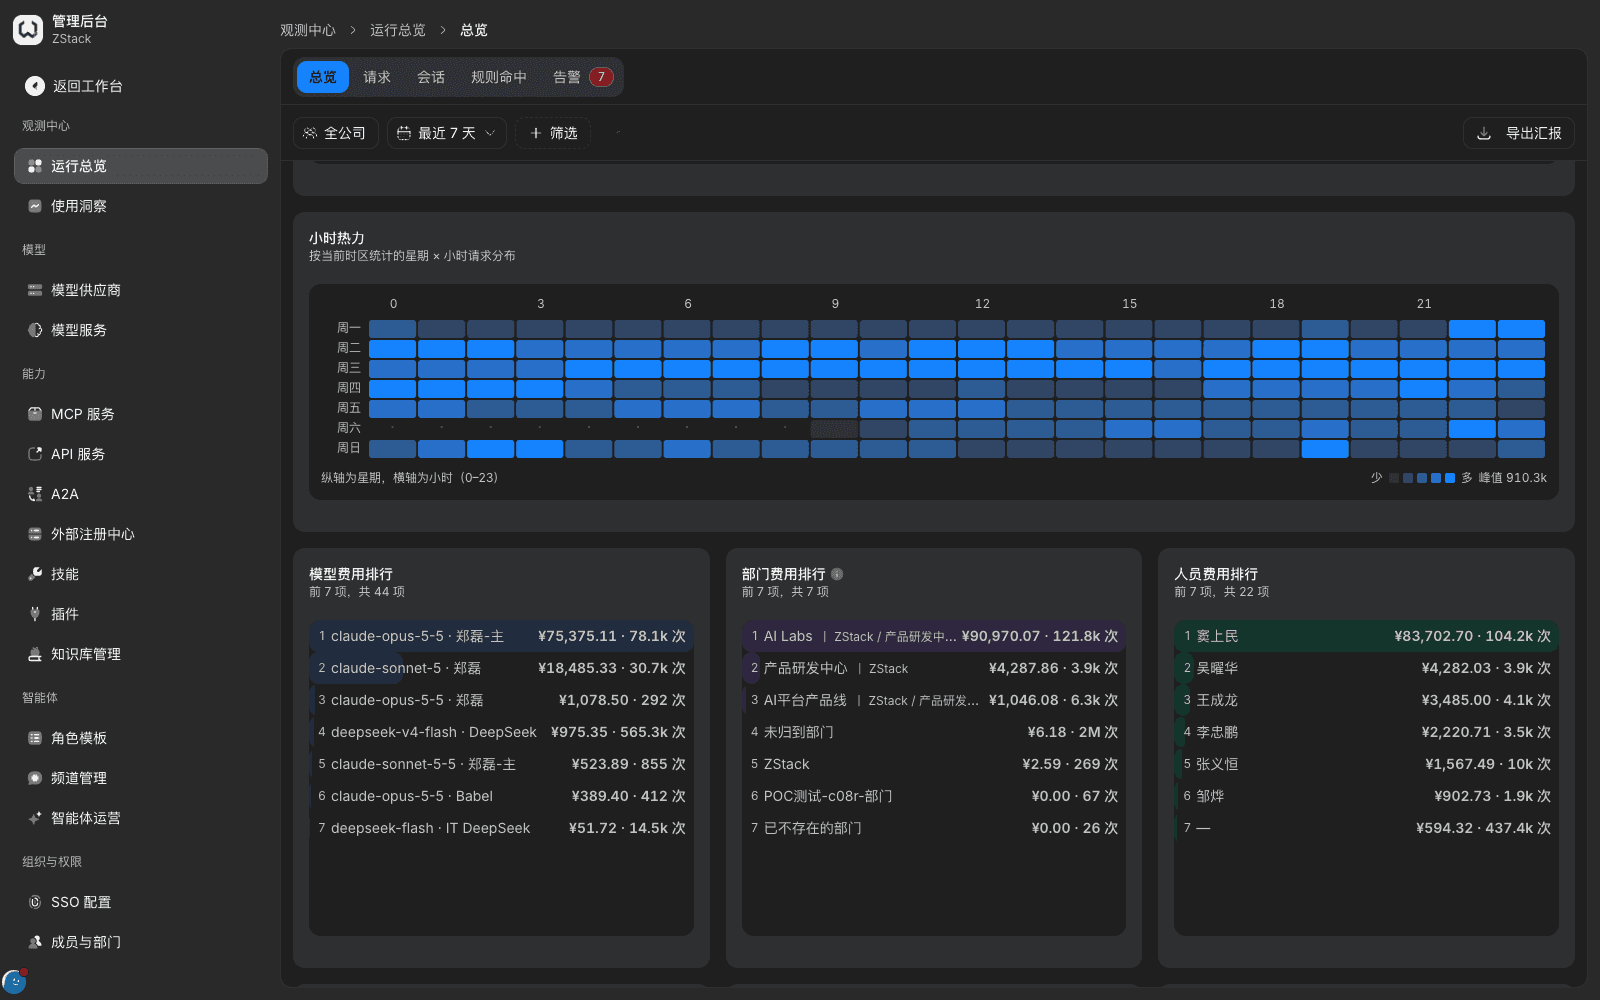
- Scroll down to the three tables 「Model spend ranking」, 「Department spend ranking」, 「User spend ranking」. Each item gives amount and call count together. Clicking any item switches to the 「Requests」 tab with the corresponding filter, so you can check row by row.
- To tell which business system is running volume, scroll to the 「Traffic flow」 panel: it shows distribution in four columns 「Access credential → Client → Model → Provider」. Each column shows only the highest-volume items; the rest are merged as 「Other N」.
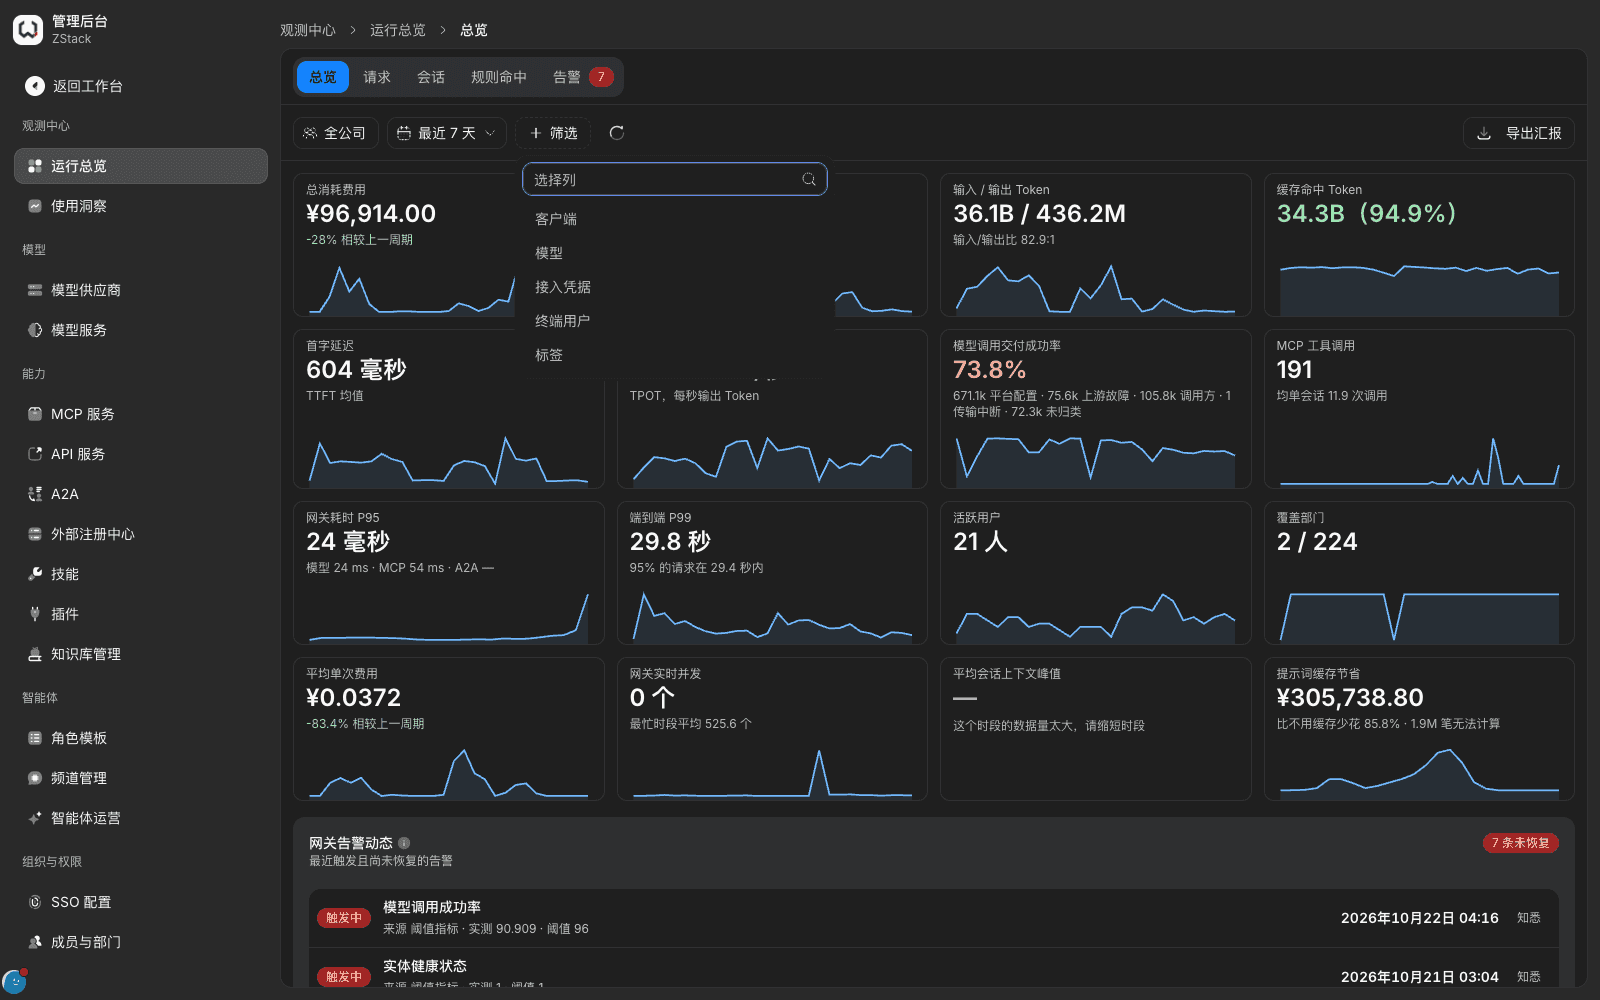
- Back in the toolbar, click 「Filter」, add 「Access credential = that credential」. Whole-page metrics converge to that credential, and 「Total spend」 is then its spend scale.
What you will see
- A model-ranking item name looks like 「model name · provider account」. At most the top several items are shown, with the total item count marked.
- Node names in 「Traffic flow」 look like 「owner · credential name」. What it counts is call count, not amount or tokens. Four node classes — 「No access credential」, 「Unknown client」, 「Unknown model」, 「Unassigned provider」 — collect calls that lack the corresponding information.
Note
- 「Traffic flow」 counts by times. To tell how much a credential spent, look at the metric cards after you narrow in step 4. 「Owner」 in a node name is the credential owner, not the person who actually operated each call.
- Rankings provide only the amount dimension. Comparing by tokens is in this chapter's Capability notes.
17.2 Check token and cost attribution
When to use this: tell whether consumption is driven by input or output, whether requests increased, whether cache is working, and check who a given call is attributed to.
Procedure
- At the top of 「Overview」, read the metric cards: 「Total tokens」 has total request count as the subtitle; 「Input / output tokens」 are listed separately with a ratio; 「Cached tokens」 has a hit rate.
- Read the 「Prompt cache savings」 card. It gives the amount and share saved versus not using cache, and the number of calls that cannot be priced.
- Use 「Filter」 to add model, client, and access credential in turn, and compare how request count and tokens change: both growing in proportion means more requests; count unchanged while tokens grow means each request got longer.
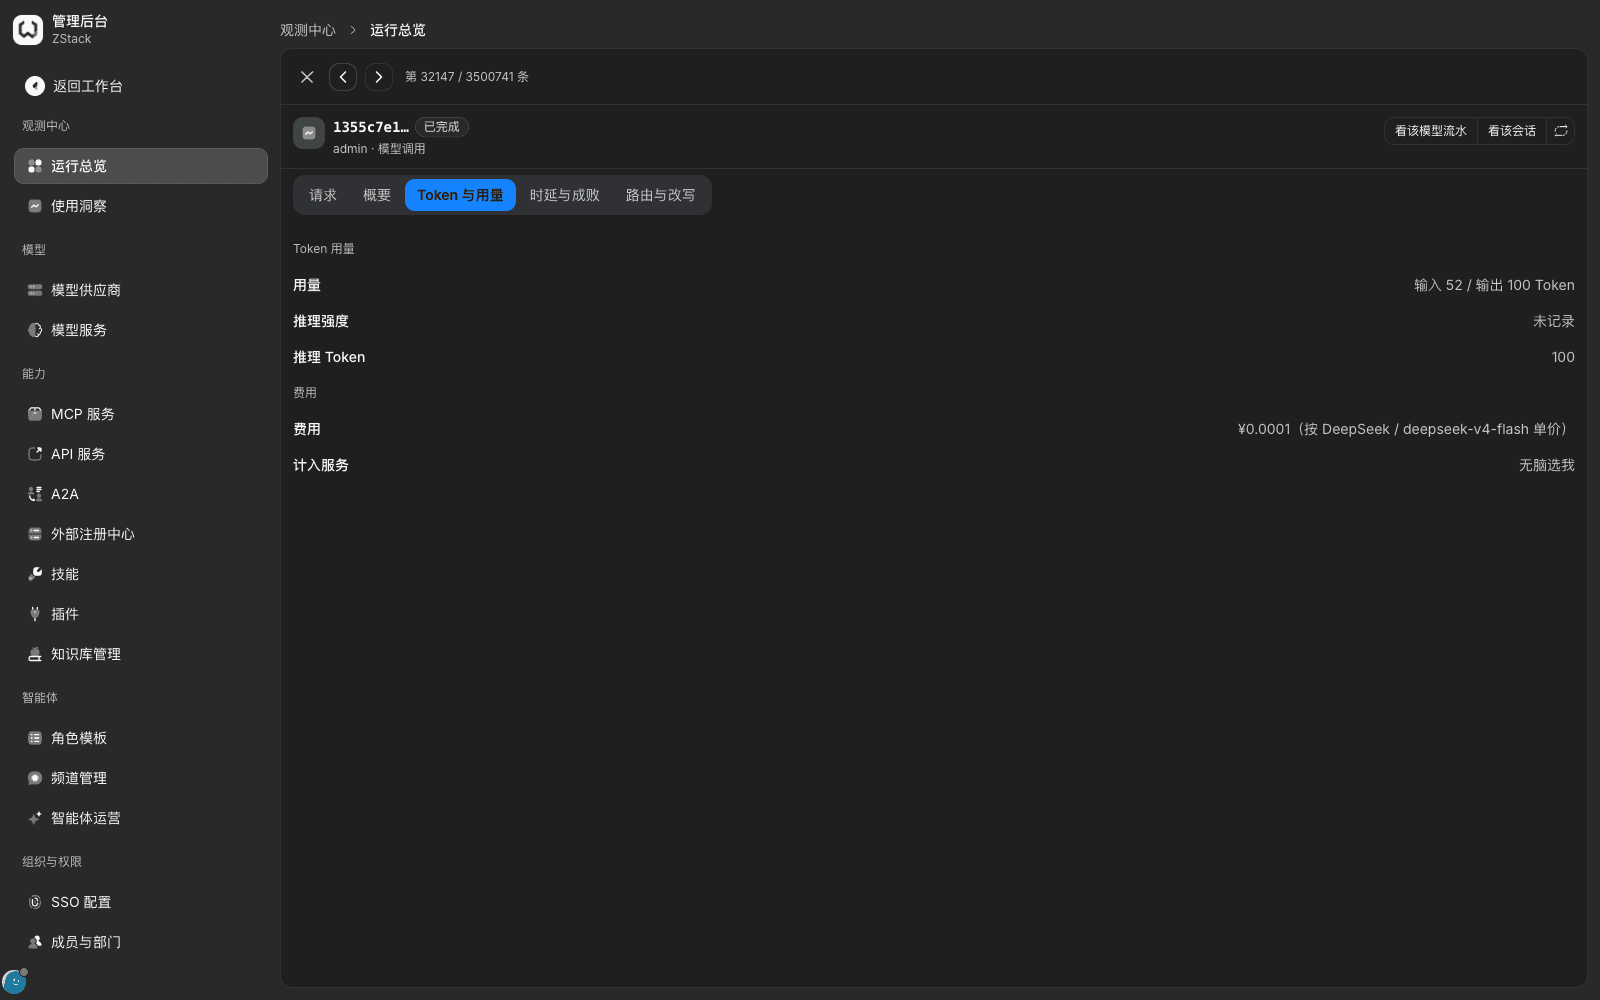
- Open a representative call, switch to the 「Tokens & usage」 tab, and check per-call usage, reasoning tokens, cost, and the counted service.
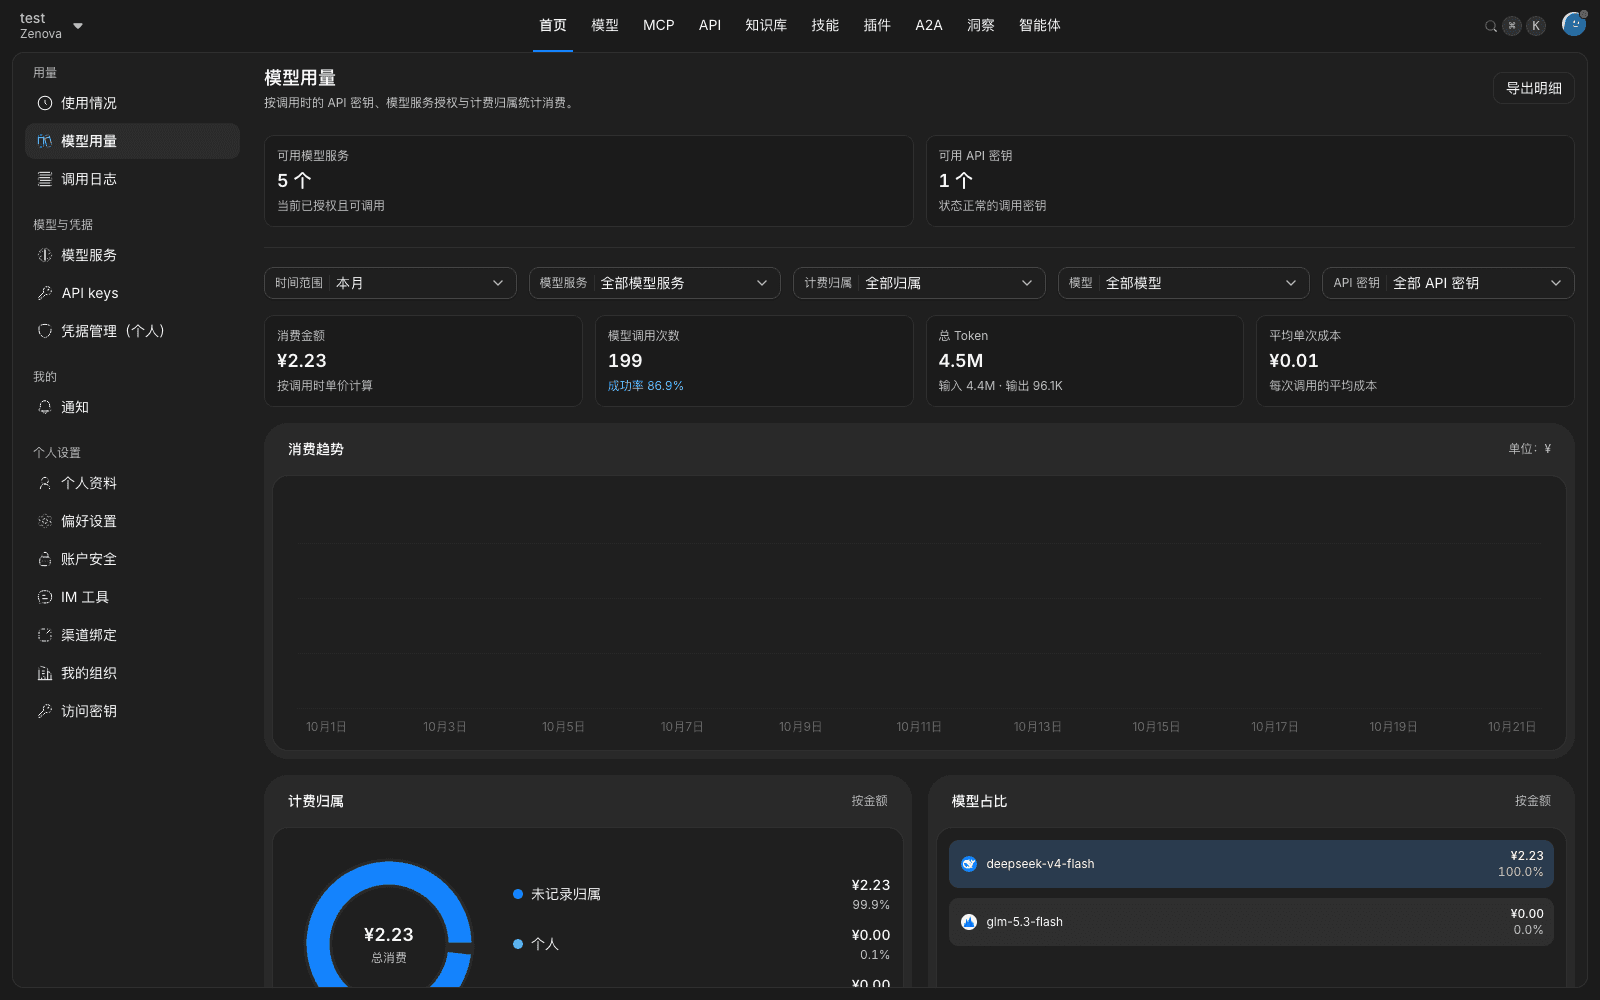
- When a member checks their own consumption, open Workspace left 「Usage › Model usage」, pick a time range (default this month), then filter by model group, billing attribution, model, and API key.
What you will see
- An 「Input / output tokens」 ratio clearly greater than 1 means cost is concentrated on the input side, usually a too-long context or a cache miss.
- 「Prompt cache savings」 is a separate card. Saved amount is not included in 「Total spend」. You cannot add the two.
- A single call's cost note is written 「at 〈provider〉/〈model〉 unit price」, and notes which model group this call was counted into.
- Member-side 「Model usage」 gives available model-group count, available API-key count, and four metric cards (spend, call count and success rate, total tokens, average cost per call). Below, amount is split by billing attribution and model. When a model is unpriced, cost is recorded as 0; tokens and count are still counted.
Note
- Attribution: each call is billed at the then-effective unit price when the call ends, and is recorded on the actor, the actor's department, and the access credential used. Department spend counts a call only once; it is not rolled up to parent departments.
- Unattributable is normal. Calls started by a service account, an actor who has left the organization, or a historical call missing attribution all land on items such as 「Not attributed to a department」 or 「— (no actor)」. Usage summaries have minute-level delay. For a just-happened call, use the request detail.
17.3 Attribute cost by tag
When to use this: the same API key serves several business scenarios, you need to bill by scenario, and department and member dimensions cannot split it.
Prerequisites: the account is a tenant administrator. The tag's English ID is a stable short name with no sensitive information, for example biz_scene.
Procedure
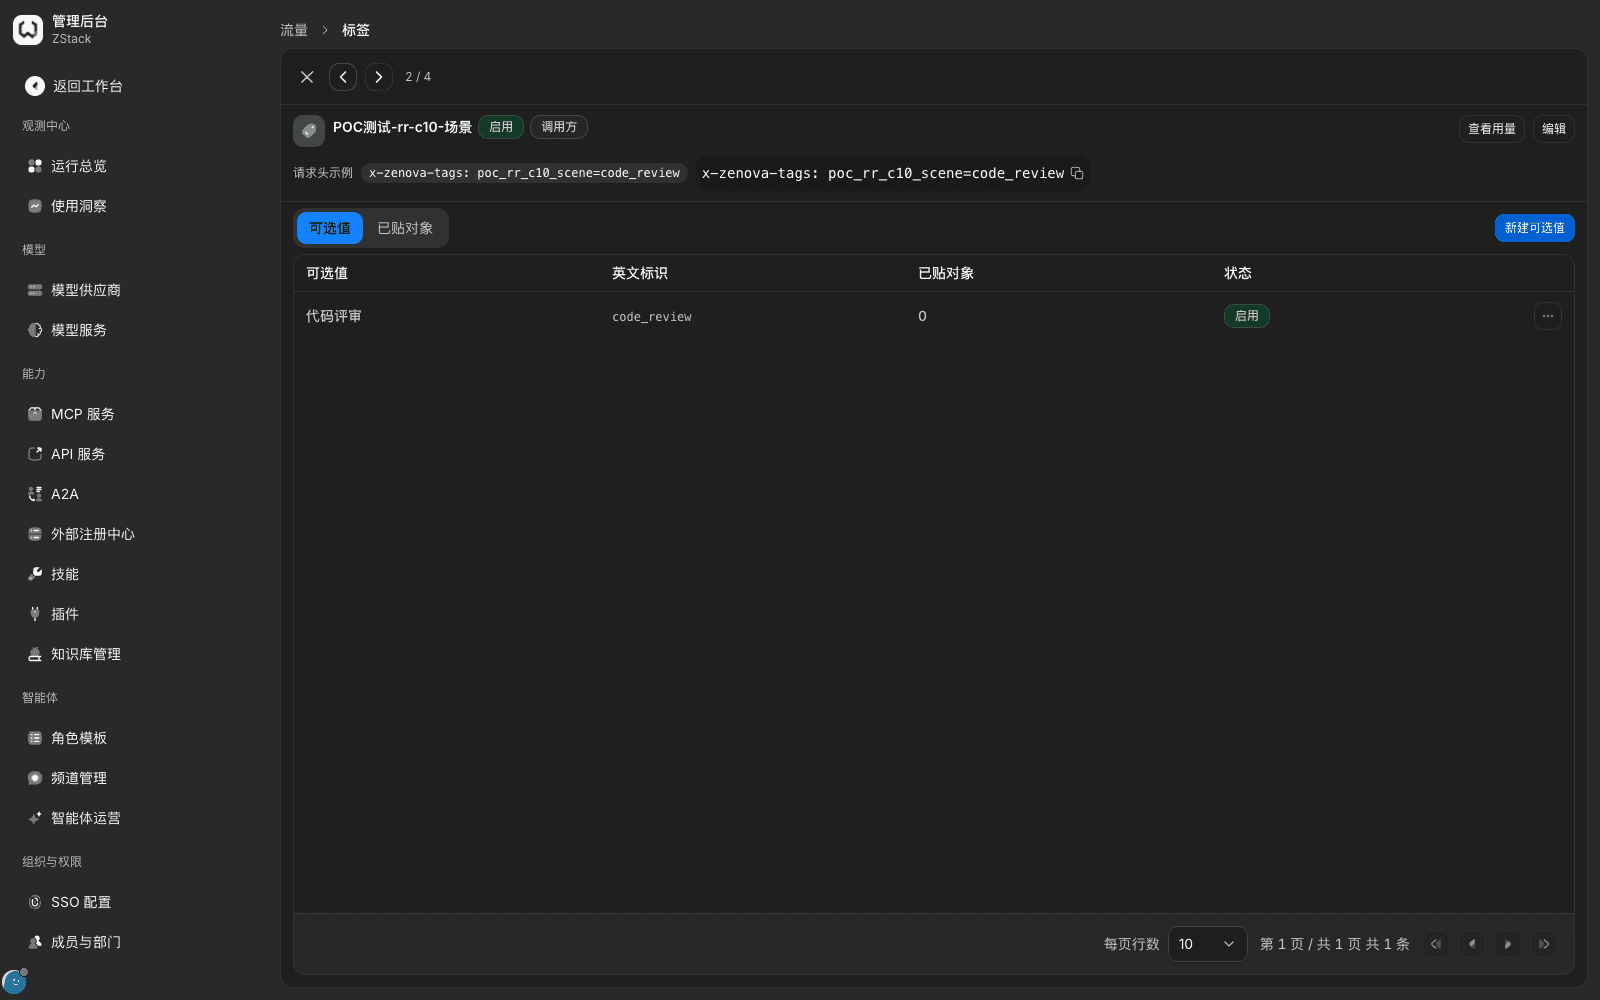
- Open 「Admin Console › Traffic › Tags」, click 「New tag」, fill 「English ID」 and 「Display name」, set 「Applies to」 to 「Caller」, and tick 「Allow the caller to declare it in a request header」.
- Open the tag detail, click 「New optional value」, and add business values one by one. The request-header example at the top of the detail can be given to the caller as-is, such as
x-zenova-tags: biz_scene=code_review:
curl https://<网关地址>/v1/chat/completions \
  -H "Authorization: Bearer <YOUR_API_KEY>" \
  -H "Content-Type: application/json" \
  -H "x-zenova-tags: biz_scene=code_review" \
-d '{"model":"通用对话","messages":[{"role":"user","content":"你好"}]}'- On the tag detail, click 「View usage」 at the top right. The page jumps to 「Operations overview」 with that tag filter already applied. For ordinary search, add 「Tag」 in 「Filter」 on 「Operations overview › Requests」. Values have two granularities: 「tag name (any value)」 and 「tag name: value」.
- The billing file is generated in 「Admin Console › Audit & compliance › Report export」: New export, 「Data」 「Usage summary」, 「Grouping」 「By tag」 and specify the tag key, set frequency and range, submit, then download from the list when the job finishes.
What you will see
- A call with the tag header returns normally. After you filter by tag, the list has only calls with that tag. Entering from 「View usage」, whole-page metrics converge to that scenario's request count, tokens, and cost.
- A 「By tag」 export file's headers are: grouping object, call count, input tokens, output tokens, cache tokens, cost, currency, stats interval.
Note
- A tag applies only to calls after it is declared. It does not backfill historical calls. After you create it, tell callers to update request headers, or cost still lands on 「Untagged」.
- For a tag key that did not open 「Allow the caller to declare it in a request header」, a caller who sends it is rejected (HTTP 400,
VALIDATION_FAILED, reasontag_not_declarable). That is an intentional reject, not a silent ignore. Declaring a value that is not in the optional values is still allowed, but that call only lands under 「tag name (any value)」 and is not attributed to any concrete value.
17.4 Meter by end user
When to use this: one business system uses the same API key for many end users, and you need count and cost by end user, not only the total of one key.
Prerequisites: there is a usable API key; the business system can generate a stable internal ID for each end user.
Procedure
- Have the business system pass an end-user identifier on every request. Either of two ways; when both appear, the request header wins: header
x-zenova-end-user: <终端用户标识>, or the top-leveluserfield of an OpenAI-protocol body. - On 「Operations overview › Overview」, click 「Filter」, add an 「End user」 condition and pick the target user. Whole-page metrics converge to that user's call volume and cost.
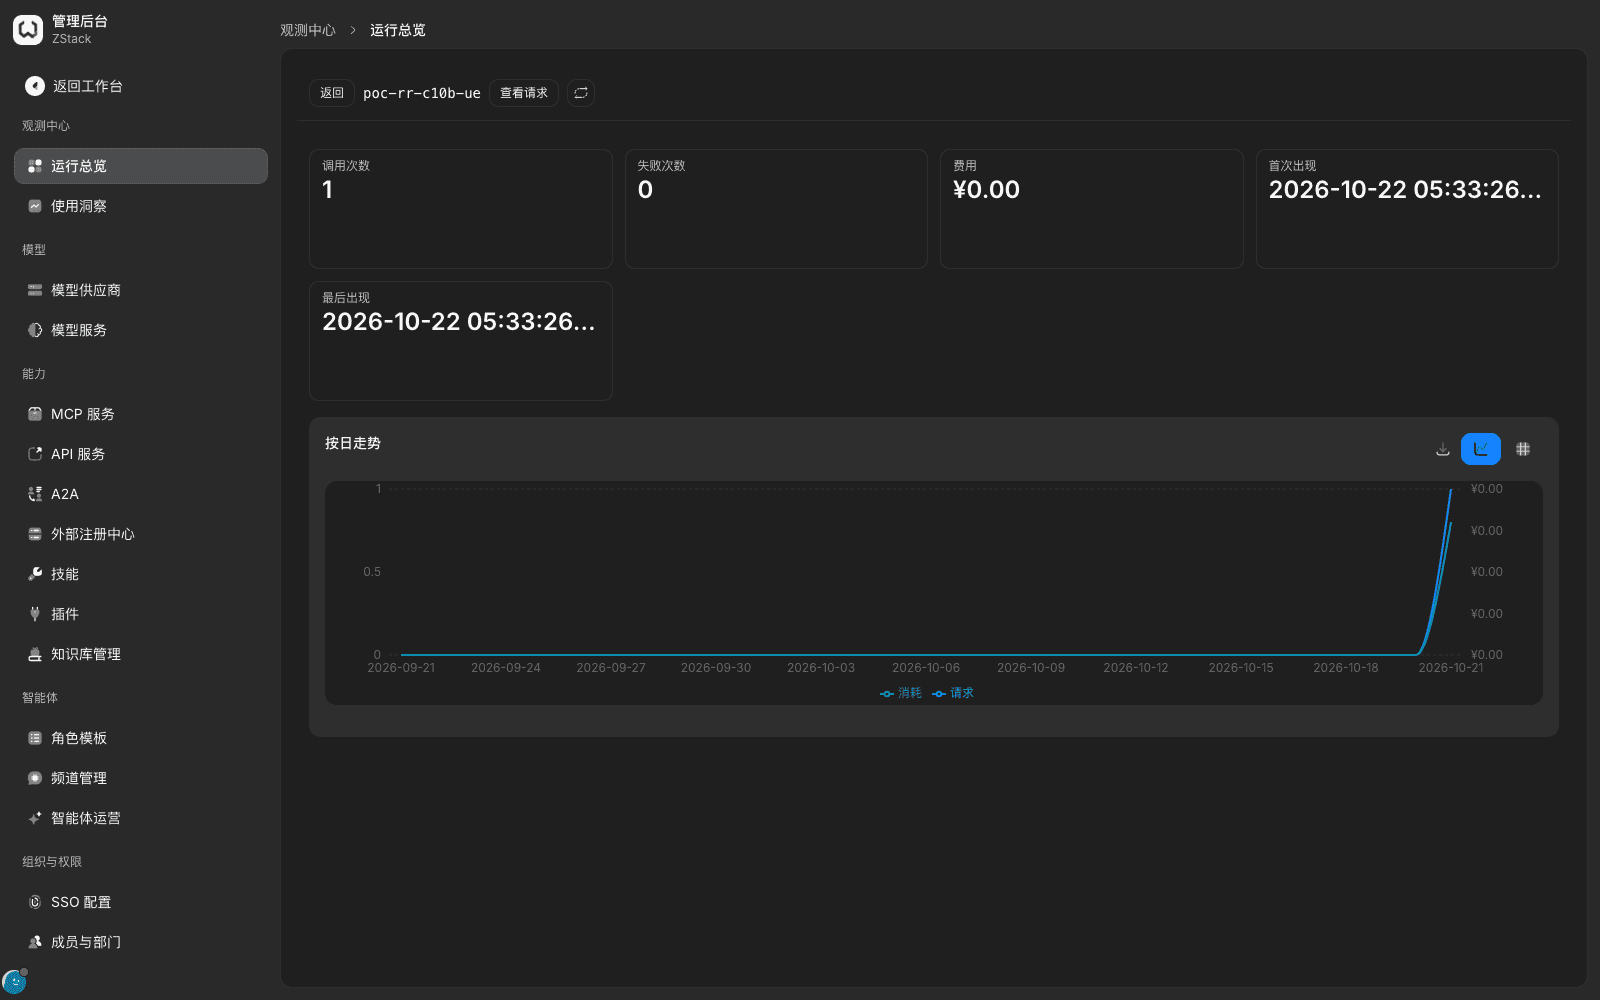
- Open the end-user detail and read 「Call count」, 「Failure count」, 「Cost」, 「First seen」, 「Last seen」, and 「Daily trend」.
- Click 「View requests」 to jump to the 「Requests」 tab filtered by that end user, and check row by row.
What you will see
- The identifier in the detail header is the original value the business system passed. 「Daily trend」 gives consumption and request curves together, so you can tell whether that user is continuous or concentrated on a few days.
- After 「View requests」, the list contains only that end user's calls, and the row count matches 「Call count」.
Note
- The identifier is defined by the business system. The platform does not verify authenticity. Do not put a mobile number, ID number, or similar sensitive information in the identifier; an internal ID is enough.
- End user and 「Actor」 are not the same thing: the actor is the platform member the API key belongs to; the end user is the final user the business system reports.
- 「End user」 filter retrieves candidates remotely on demand. Expanding it does not pre-list everyone. Typing the full identifier is the most reliable. The request-detail 「Summary」 tab does not list this field on its own. To see the identifier that was actually passed, open request headers on the 「Request」 tab.
17.5 Attribute hidden consumption by purpose
When to use this: spend from an employee asking a question directly is easy to understand, but sub-agents, context compression, retries, and similar calls an agent produces in the background also cost money, and you need to find that consumption.
Prerequisites: the call was started by a platform-hosted agent, or the session has client reporting enabled (section 19.3).
Procedure
- In 「Filter」 on 「Operations overview › Requests」, add 「Purpose」 and expand the values: chat, embedding, rerank, image generation, image edit, speech synthesis, speech-to-text, judgement, video generation. This field is endpoint purpose.
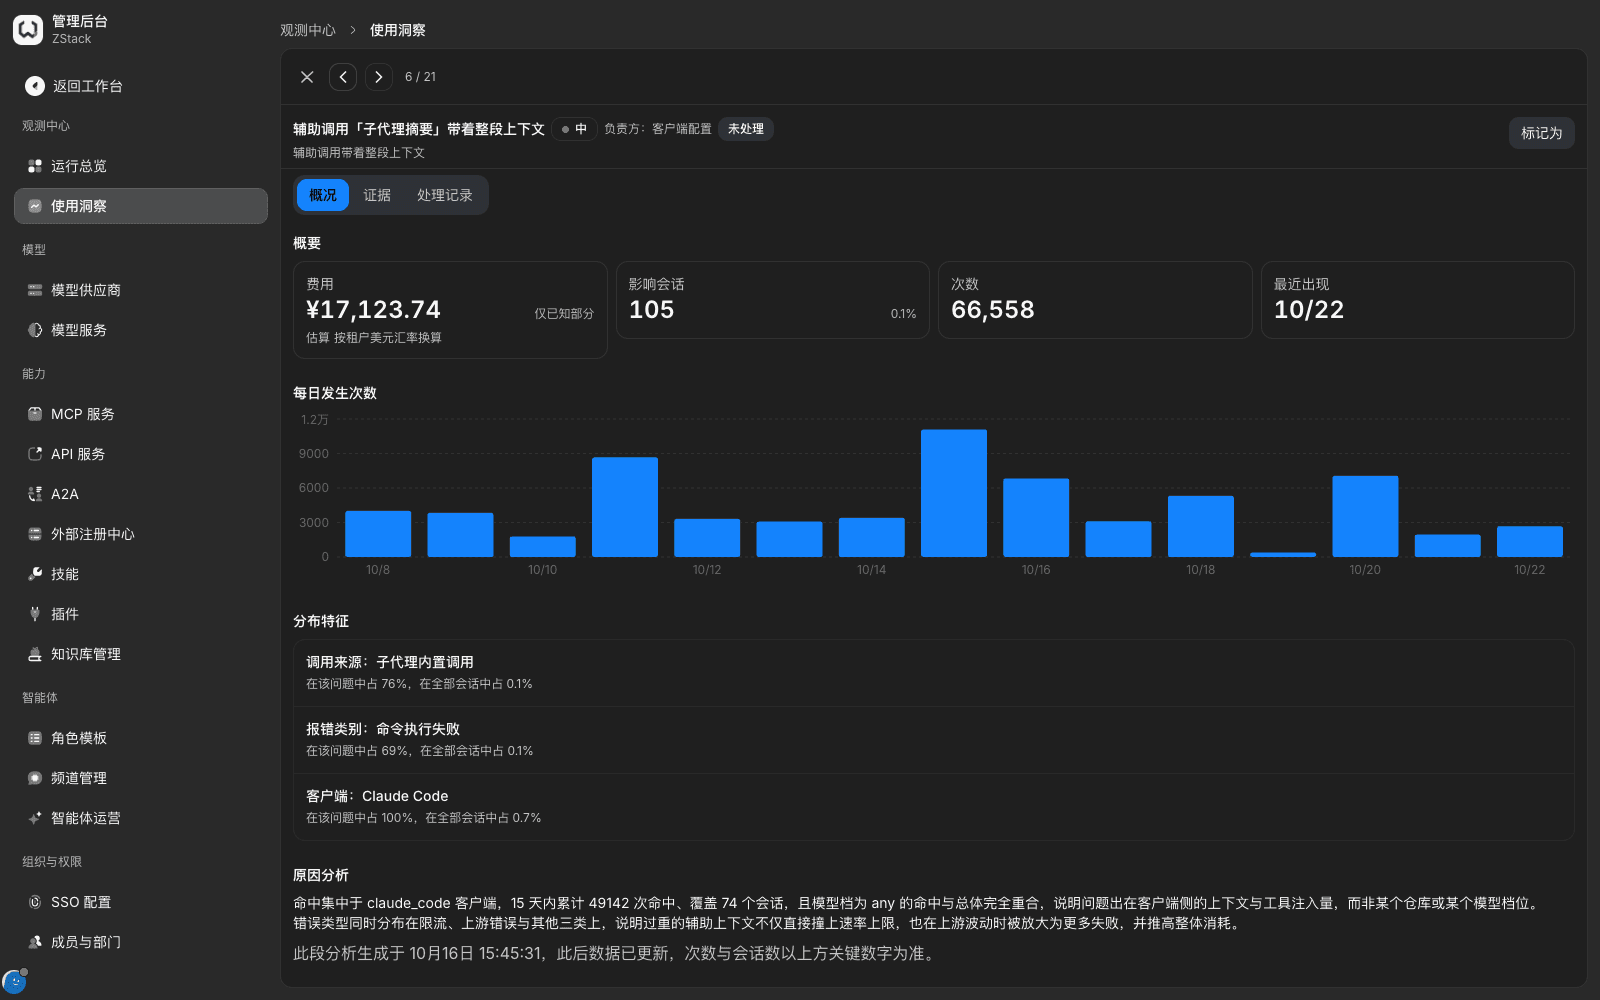
- Open 「Admin Console › Observability › Usage insights › Issues」, find an auxiliary-class issue (for example 「Auxiliary call '…' carried the whole context」), and click into the detail.
- In 「Distribution features」, read the 「Call source」 dimension. It gives the share of sources such as 「Built-in sub-agent call」 in this issue and in all sessions.
- To check turn by turn, open the session-detail 「Summary」 tab and read the 「Retry · channel switch · queue」 counts. Then export JSONL 「Turn operations detail」: one turn per line, with sub-agent, auxiliary-call, and context-compression lane counts plus that turn's retry count.
What you will see
- Values of the 「Purpose」 filter are endpoint purposes, not the same concept as 「Call purpose」. Do not mix the two.
- Internally the platform records a 「Call purpose」 on every call. Values include user conversation, sub-agent, context compression, retry, canary, platform internal call, console trial, shadow dispatch, plus judgement-class calls such as guardrail, intent recognition, and sensitive-information recognition. Canary and platform internal calls are not counted on the tenant bill.
Note
- Calls from a client connected with an external API key (for example a coding assistant) are all metered as 「User conversation」. Sub-agent, compression, and title-generation calls those clients produce themselves cannot be separated from the main conversation on the gateway side. To split by purpose, have a platform-hosted agent start the call instead.
17.6 Control cost with budgets and a hard wall
When to use this: cap tokens or amount in a period for a member, department, or functional group; or set a hard cap on a trial service or a batch service so unexpected volume cannot run.
Prerequisites: the account is a tenant administrator, or has manage permission on that model group. Before you set a money budget, models in the group must have a published upstream price. When unpriced, the dialog prompts 「None of this group's upstreams has a published price yet, so a money budget cannot be filled for now」. Price them on the 「Price」 page first (Chapter 5).
Procedure
- Open 「Admin Console › Organization & Access › Model Groups」, open the target group, and choose the 「Visibility & quotas」 tab.
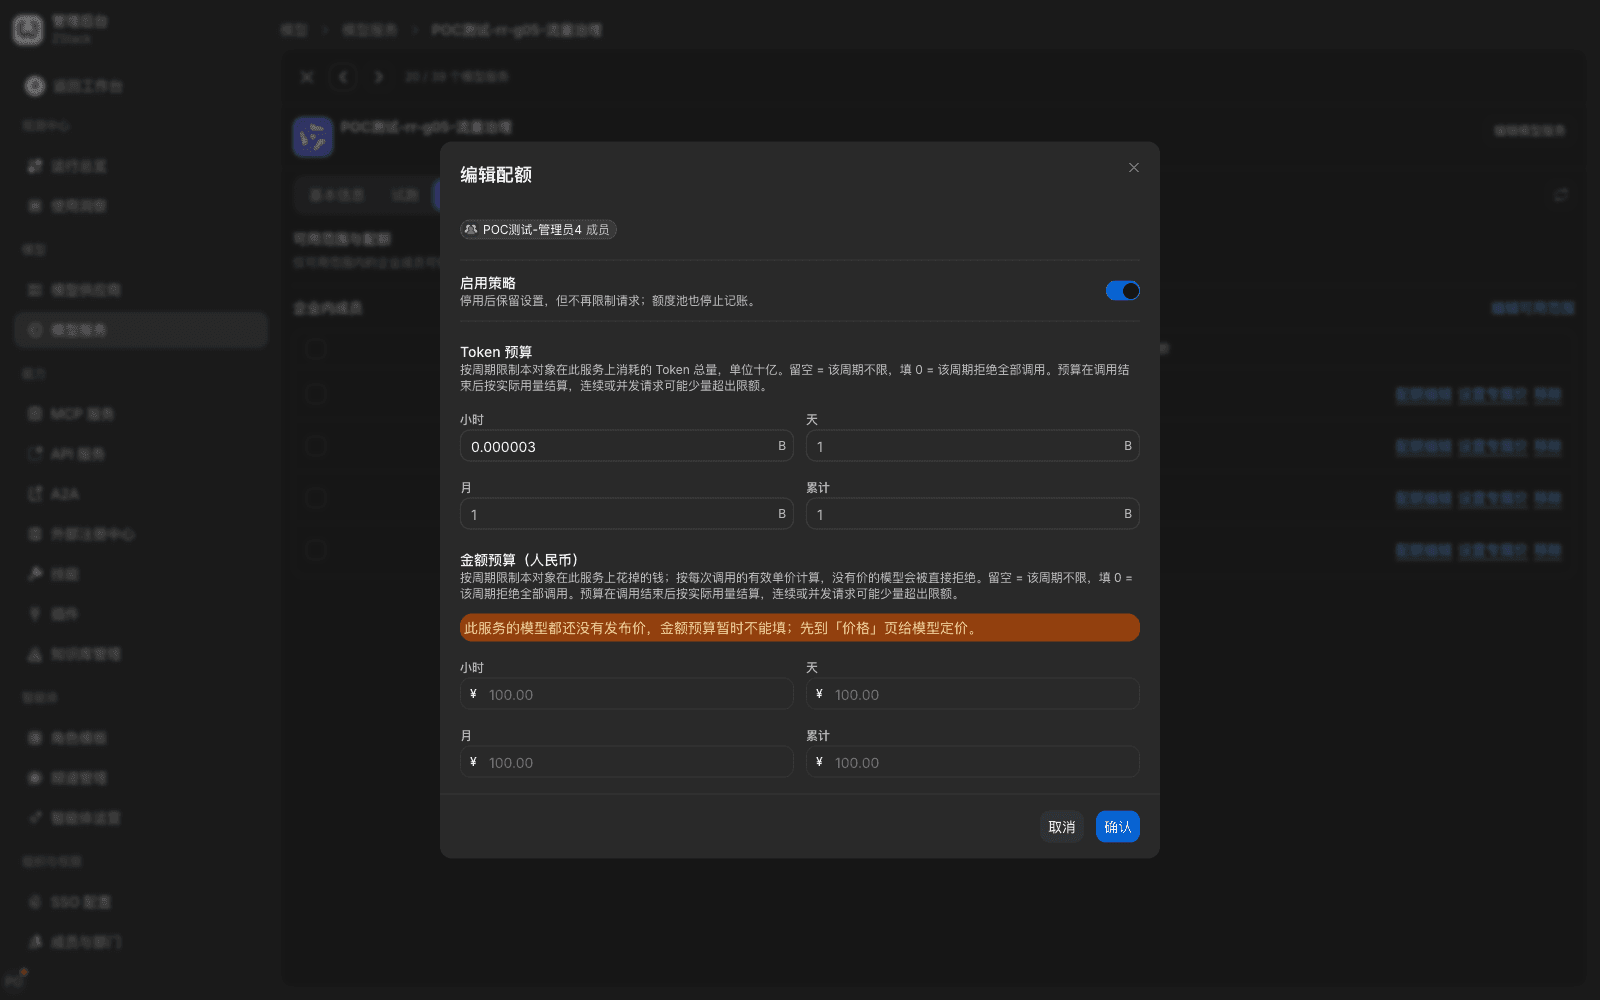
- On the object row you need to limit, click 「Edit quota」, and confirm the 「Enable policy」 switch is on.
- In 「Token budget」, fill a cap per period (unit billion B, for example
0.000003means 3000 tokens). In 「Money budget (CNY)」, fill an amount cap per period. Leave a period you do not need to limit empty, then click 「Confirm」. - To limit the whole service (not split by object), on the service-detail 「Basic information」 tab click 「Edit quota」, fill 「Service-level quota」, and confirm.
What you will see
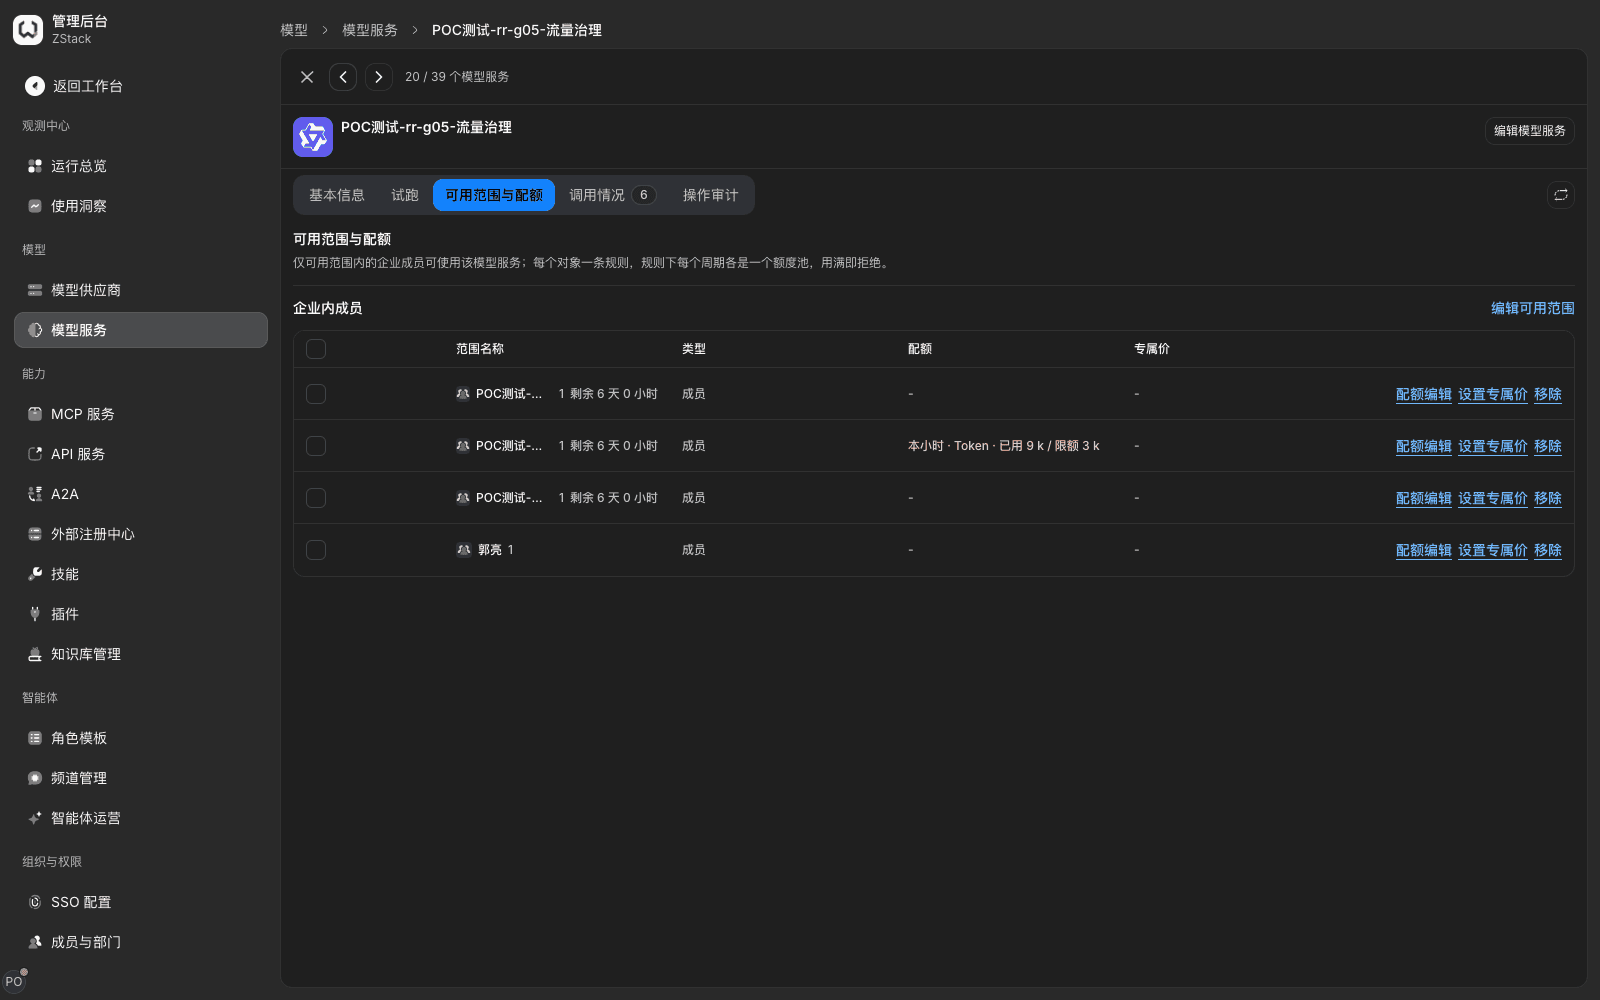
- After save, the object row shows used and limit in four rows 「This hour / Today / This month / Cumulative」. Over the limit, the row is marked red.
- After overage, the call returns HTTP 429. In the error body,
budgetdistinguishes whether a token budget (token) or a money budget (money) fired,periodgives the period,window_endgives when the window ends. Response headerx-should-retry: falsemeans do not retry:
{
  "error": {
    "type": "insufficient_quota",
    "code": "insufficient_quota",
    "reason": "POOL_EXHAUSTED",
    "details": [{
      "reason": "pool_exhausted",
      "metadata": { "budget": "money", "period": "hour", "used": "…", "limit": "…", "window_end": "…" }
    }]
  }
}
Note
- Billing: quota is accounted after the call ends, by actual usage. A single call may therefore push used over the limit; rejection starts from the next call. Overage is at most one request's usage. Leave headroom on the limit when a single call uses a lot.
- Empty and filling 0 mean the opposite: empty means that period is unlimited; 0 means that period allows nothing. To cancel every period's limit, turn off 「Enable policy」; do not clear every period — if you only clear periods and the switch stays on, the dialog prompts 「An enabled policy must keep at least one period budget」. After you turn off 「Enable policy」, settings are kept but no longer limit requests, and the quota pool also stops accounting.
- Hour, day, and month roll on the natural period. 「Cumulative」 accumulates from enable onward. A saved quota does not take effect instantly; wait a moment after you adjust, then verify.
- A money budget meters only priced models: a call with a money budget skips unpriced models. When every available model is unpriced, it returns 429, reason
POOL_MONEY_UNPRICED. Fill published prices on the 「Price」 page first. Quotas only control totals. Rate and concurrency limits are configured in traffic rules (Chapter 15).
Capability notes
| Capability not provided | What to do instead |
|---|---|
| A spend ranking sorted by tokens | Narrow one by one with 「Filter › Model」 and read 「Total tokens」, or export a usage summary and sort (section 17.3) |
| A ranking split by API type | Look by 「Upstream endpoint」 on the 「Requests」 tab, or export full call records and group (section 20.1) |
| A side-by-side workspace spend ranking | Switch 「Data scope › Workspace」 one by one and read 「Total spend」, or export detail rows and summarize (section 18.2) |
| A reason note for unattributable records | Open a representative call and judge from actor, access credential, and client fields in 「Summary」 (section 17.2) |
| Split hidden consumption of an external client by call purpose | Estimate from lane counts in a session export, or have a platform-hosted agent start the call (section 17.5) |
| A push when a single object's quota nears a threshold | Look at 「Near limit」 status on the 「Budgets」 panel of 「Operations overview」 (section 18.1) |
| Monthly plans and remaining plan quota | An administrator sets a period quota for the object in the model group, and sets a 「Target-specific price」 for particular objects (sections 17.6, 18.6) |
Previous: 16. Gateway extensions and Open API · Next: 18. Usage and cost analysis
16. Gateway extensions and Open API
Full-length chapter. Content is checked against the 2026.10 mainline code and the live console; menus and features depend on the current license, account permissions, and delivered environment.
18. Usage and cost analysis
Full-length chapter. Content is checked against the 2026.10 mainline code and the live console; menus and features depend on the current license, account permissions, and delivered environment.