21. Problem diagnosis and handling
Full-length chapter. Content is checked against the 2026.10 mainline code and the live console; menus and features depend on the current license, account permissions, and delivered environment.
Back to overview · Full table of contents · Download full PDF
This chapter: for on-duty administrators and technical support who investigate issues for callers. It is organized by 「symptom」: where to look and who handles it when a call fails, a request never returns, it is rate-limited, circuit-broken, blocked by a guardrail, or the upstream errors. Then how to read a request detail, how common error codes map, and finally how to fold scattered one-off failures into a systemic issue.
21.1 First step of investigation: get three pieces of information
When to use this: the caller reports 「it will not go through」, but cannot say why.
Before you look at pages, ask for three things. Every later step depends on them:
- HTTP status code:
401,403,404,429,502,503,504each land in a different stage. reasonin the response body: the stable reason code the platform gives, more precise than the status code. Both are429, butTRAFFIC_RATE_LIMITEDis a local limit andLLM_RATE_LIMITEDis upstream rate limiting; the owner is different.x-request-idin the response headers: use it to locate this call directly.
Procedure
- Open 「Admin Console › Operations overview › Requests」 and paste
x-request-idin the search box. - If the caller did not keep the identifier, filter by 「Actor」, 「Access credential」, and time range instead, and set 「Result」 to 「Failed」.
- Open the record and enter the request detail.
What you will see
- 「Latency & outcome」: status, HTTP status code, which stage the failure happened in, error kind.
- 「Routing & changes › Hit records」: which rule matched, what action was taken.
- 「Routing & changes › Upstream attempts」: an attempt record means the request was sent upstream; none means it was stopped inside the gateway. That immediately splits 「it will not go through」 in two — either change a rule, or check the upstream.
21.2 Call failed: authentication, authorization, and model not found
When to use this: the caller received 401, 403, or 404, and the request was never sent upstream.
| Status | reason | Meaning | Who handles it |
|---|---|---|---|
401 | LLM_AUTH_FAILED (invalid_api_key) | The key is invalid: it does not exist, was deleted, is disabled, or is incomplete | The caller checks the key; an administrator checks key status |
403 | PERMISSION_DENIED | Not in the available scope of a group that contains this model, or rejected by a traffic rule | An administrator checks available scope and rules |
404 | LLM_MODEL_NOT_AVAILABLE (model_not_found) | The requested model is not in the services available to this key | The caller uses the correct model name |
Procedure
- In 「Admin Console › Organization & Access › Model Groups」, open the target group's 「Available scope」 and check whether the caller or their department or functional group is in it.
- In 「API key management」, search the key by name or prefix and check whether it is 「Disabled」.
- For
403, in the request-detail 「Hit records」 confirm whether a traffic rule rejected it.
What you will see
- Each of the three protocols returns its native error structure, but they carry the same
reason. The same authentication failure isinvalid_api_keyon OpenAI,authentication_erroron Anthropic, andUNAUTHENTICATEDon Gemini. - Request-side errors such as
400,401,404,413havex-should-retry: falseon the response, meaning a retry as-is will not change the result.
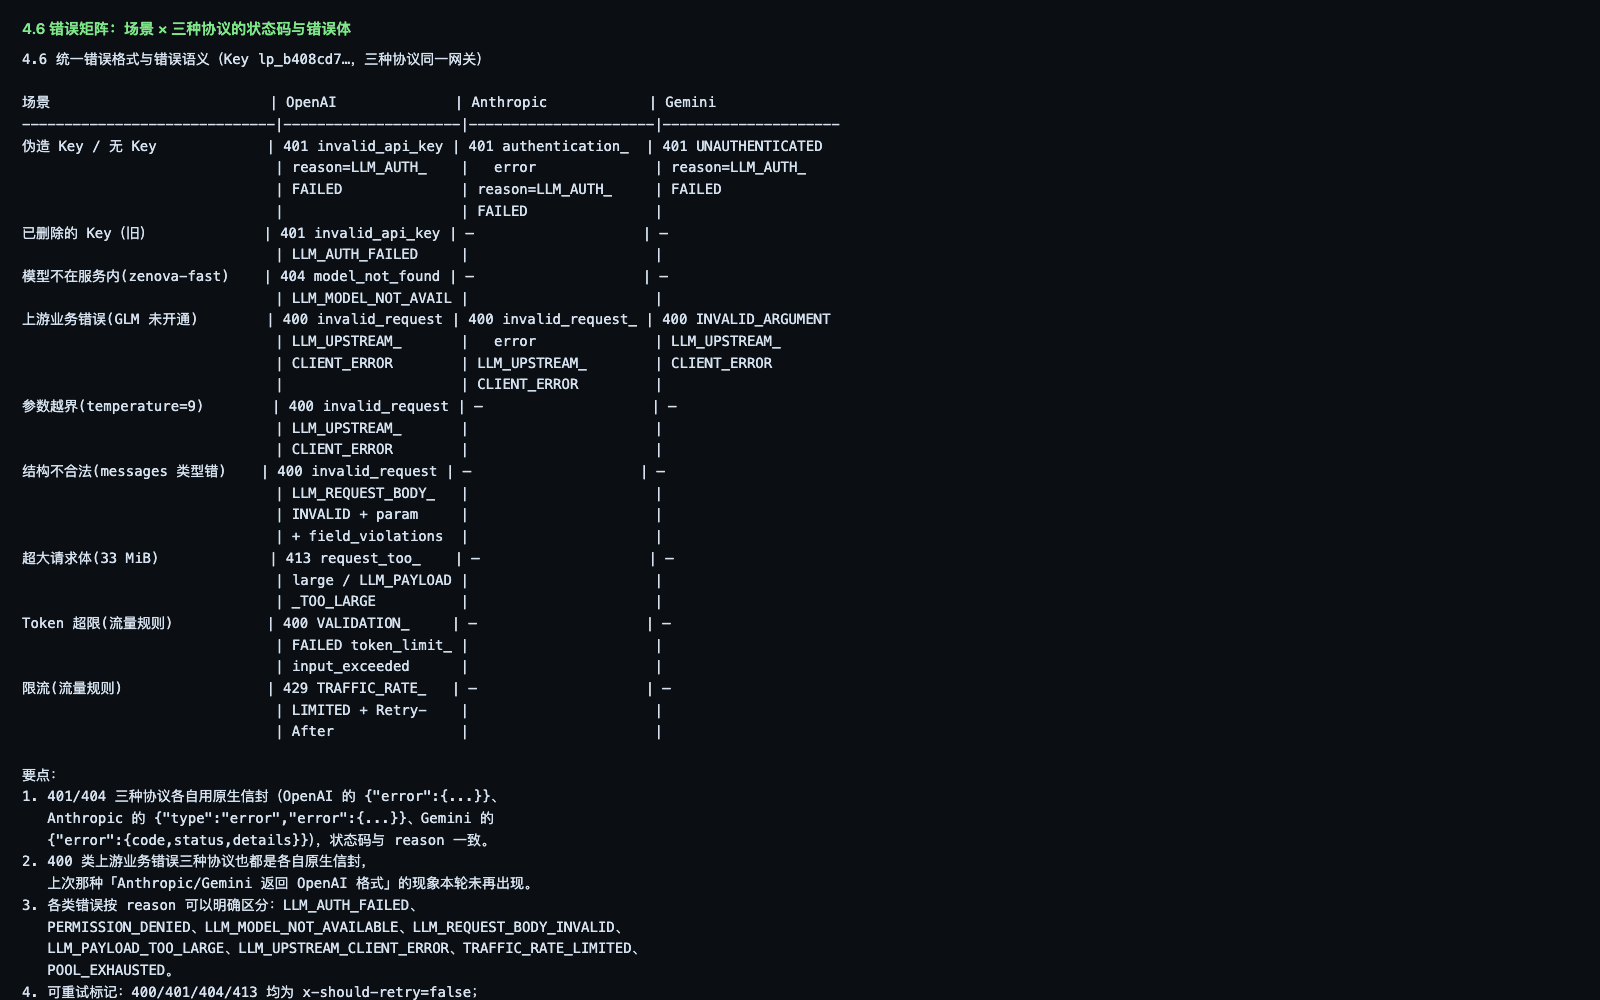
Note: 403 has two sources — available scope not authorized, or rejected by a traffic rule. The former changes 「Available scope」; the latter changes the rule. Confirm which in 「Hit records」 before you handle it, or you will change configuration in the wrong place.
21.3 The request never returns: timeout
When to use this: the caller waits a long time and then receives 504, or the client disconnects before the platform times out.
Timeout has two layers: how long the gateway waits for the upstream (configured on a rule), and the caller's own client timeout. Separate which layer arrived first.
Procedure
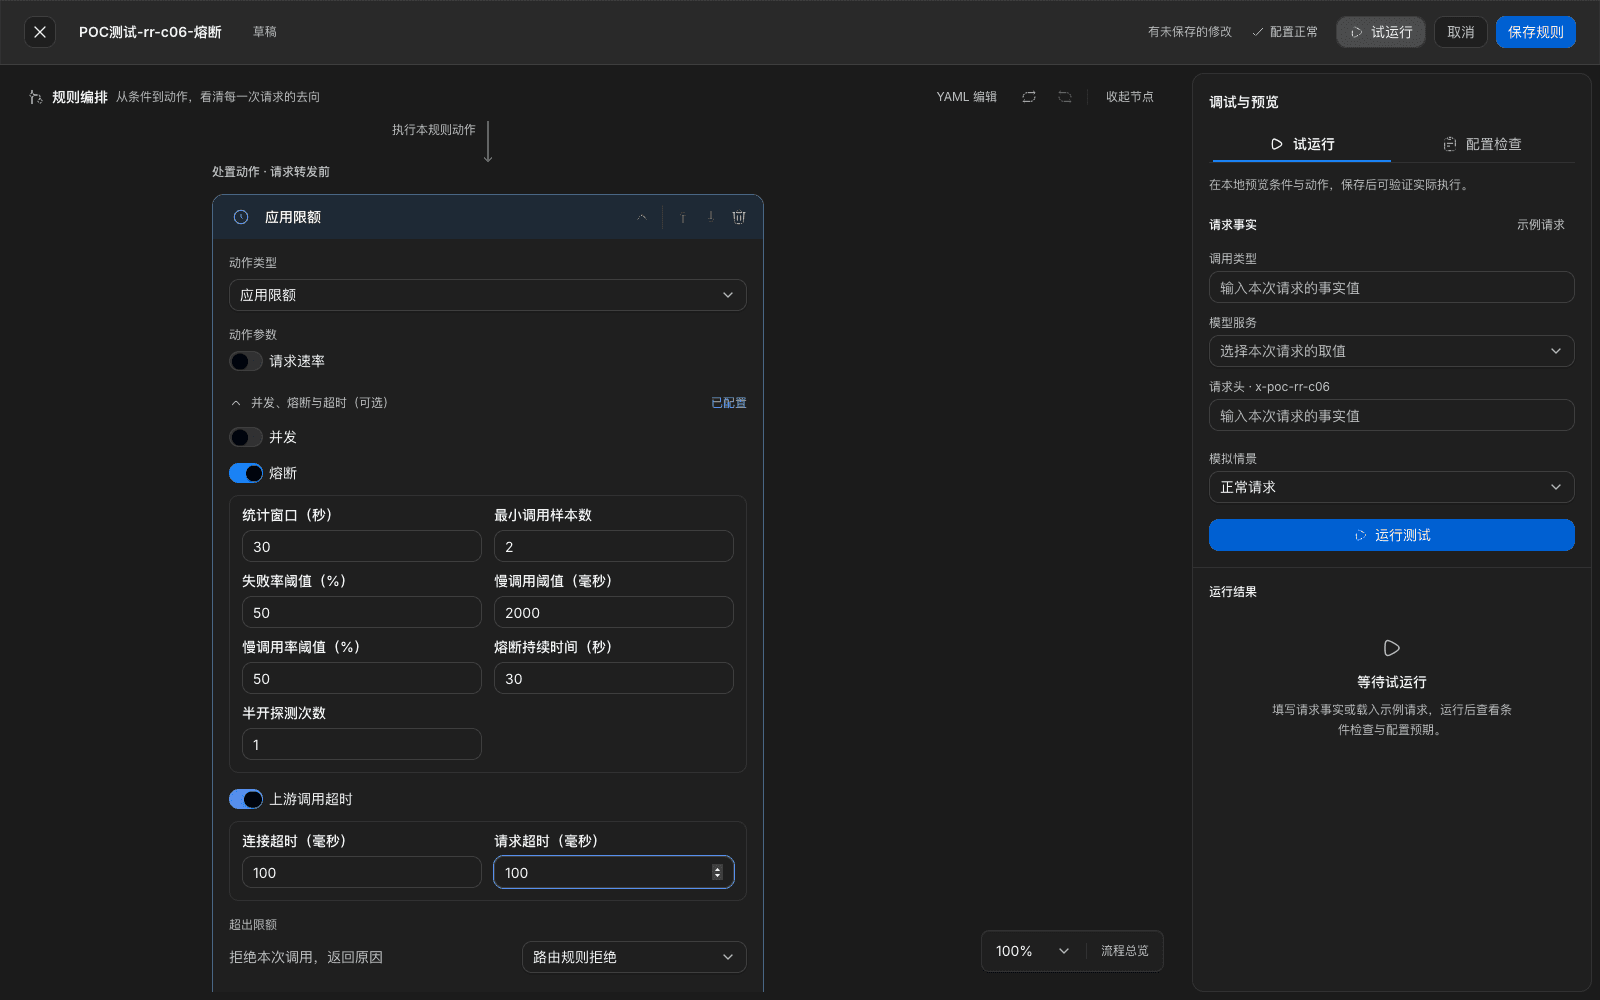
- In 「Traffic rules › New rule」, narrow conditions, for example 「Call type = model call」 plus a dedicated request header, so other callers are not affected.
- Add the action 「Apply limits」, and expand 「Concurrency, circuit breaker, and timeout (optional)」.
- Turn on 「Upstream call timeout」, and fill 「Connect timeout」 and 「Request timeout」 (milliseconds).
- Save. In 「Review this change」, check, then click 「Confirm and apply」.
What you will see
-
When the upstream does not respond in time, the client receives
504:{"error":{"message":"The upstream model service timed out.","type":"server_error","code":"timeout","reason":"LLM_TIMEOUT"}} -
These requests have an upstream-attempt record. Upstream latency is close to or over the configured request timeout.
Note
- Set request timeout to the upstream's real response time. Too small treats a normal long answer as a timeout. Too large means the client has already disconnected while the gateway is still waiting, occupying the connection for nothing.
- Millisecond-scale timeout values are only for verifying the timeout path in a test environment. Do not use them on production rules.
- When the upstream is genuinely slow, also consider adding a provider account, configuring a backup tier (see 21.7), or switching to a faster model.
21.4 Rate limited: request rate, concurrency, and queue
When to use this: the caller received 429, or you need to set a call cap for a caller.
Procedure
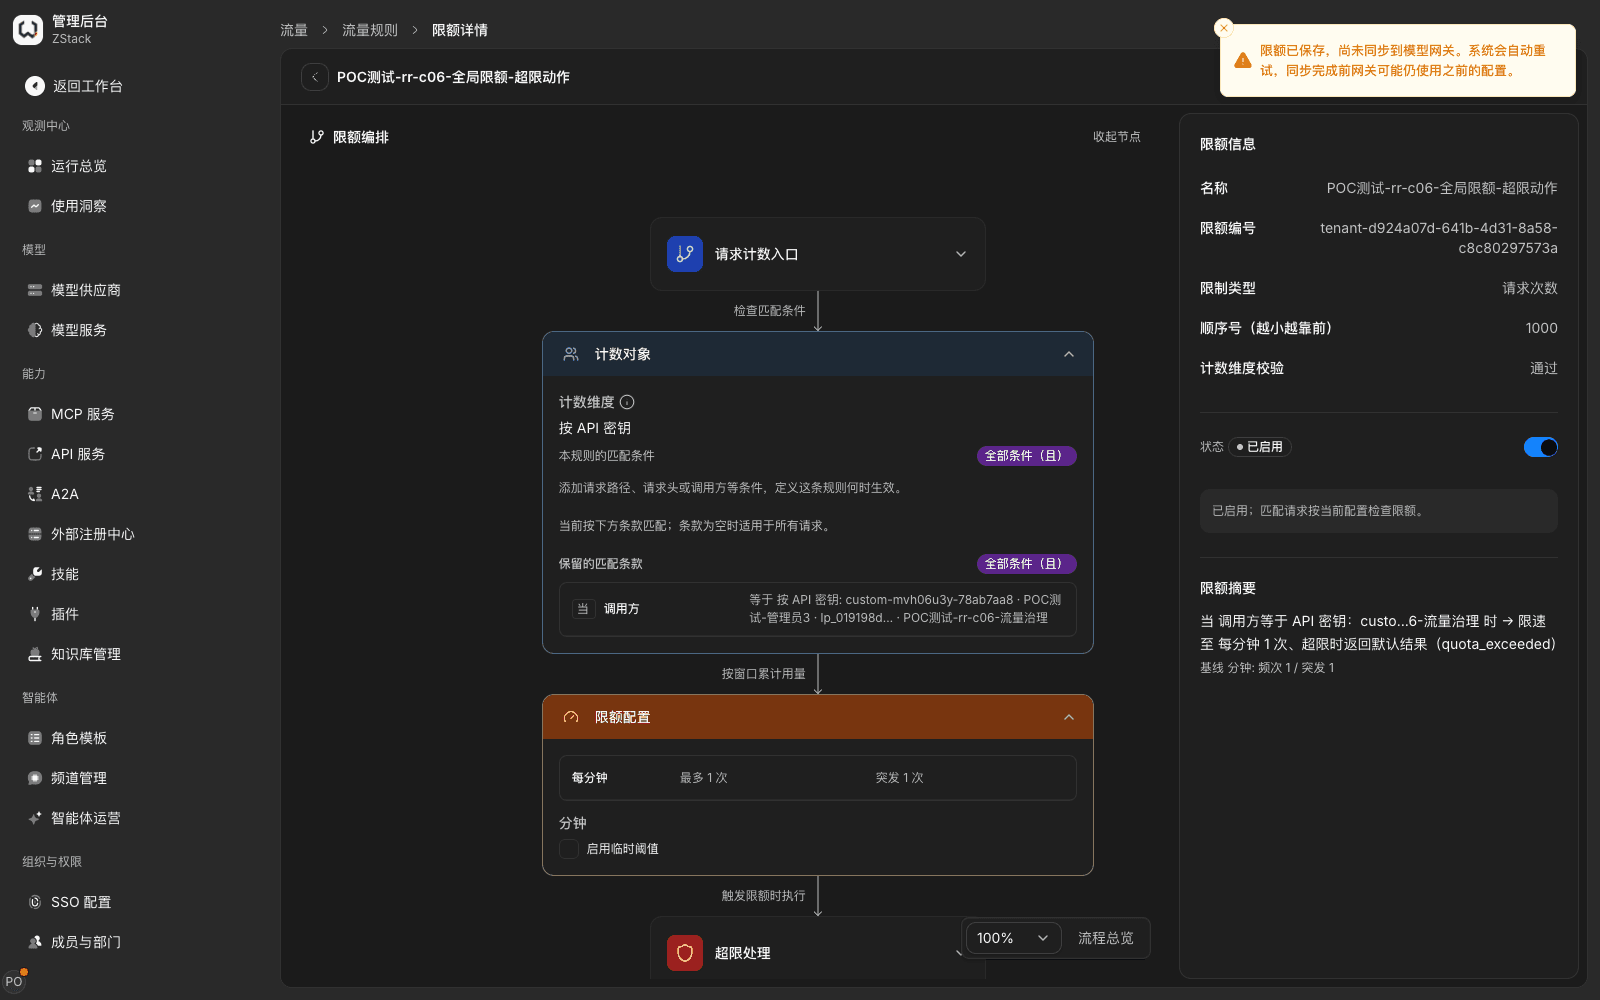
- In 「Traffic rules › Global limits」, click 「Add limit」 and fill a name.
- Choose 「Count dimension」 (for example 「By API key」), and fill 「Match conditions」 to select the caller.
- Choose 「Window」 (for example 「Minute」), and fill 「Requests per period」 and 「Immediate burst」.
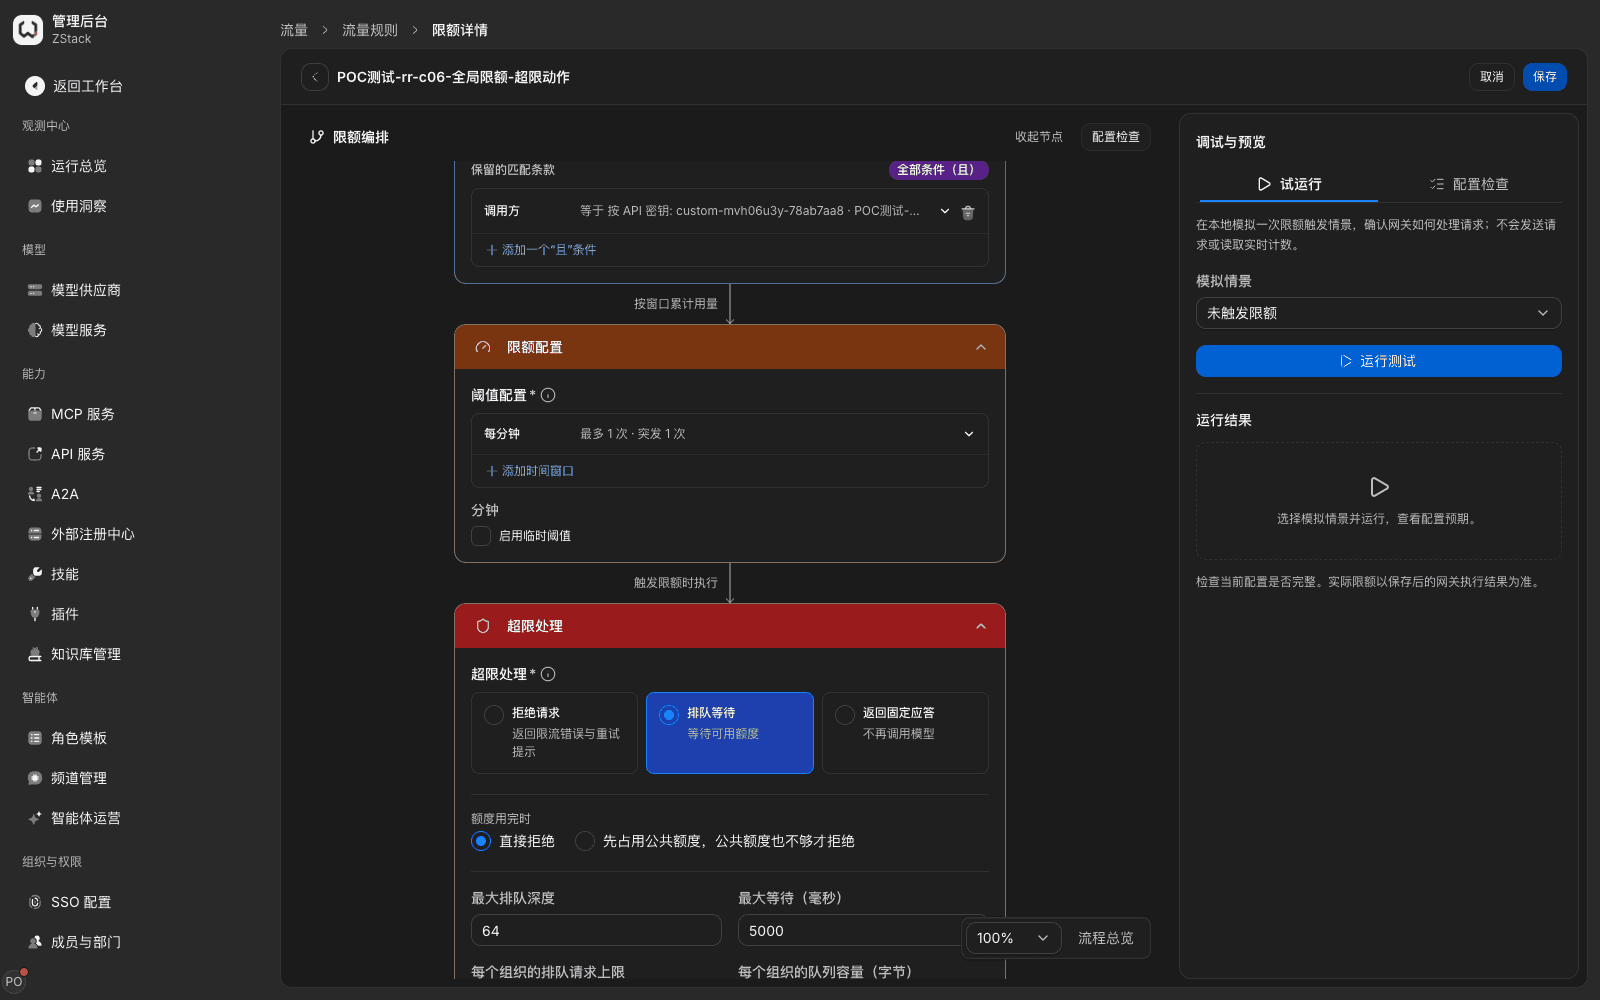
- In 「When over the limit」, choose the action, fill extra parameters as needed, and save.
What you will see: the three overflow actions behave differently.
| When over the limit | The client receives | Notes |
|---|---|---|
| Reject immediately | 429, reason TRAFFIC_RATE_LIMITED, with Retry-After | Upstream latency is 0 ms; the request is not sent upstream |
| Queue and wait | Waits then returns normally when the queue has a slot; 429 with reason TRAFFIC_QUEUE_TIMEOUT when over the cap | Fill 「Max queue depth」 and 「Max wait」 (milliseconds) |
| Return a fixed reply (do not call the model) | HTTP 200, body is the configured assistant reply | Does not call the model; not an error |
- When you choose 「Return a fixed reply」, the response body has
zenova_degraded: true,reason_code(for examplequota_exceeded), andretry_after_seconds. Everyusagefield is 0. The call is not billed.
Note
- 「Return a fixed reply」 returns
200, not an error code. A caller that looks only at the status code will treat the degraded reply as a normal answer. Judge byzenova_degradedorreason_code. - Limits are accounted after the call ends. A single call may push usage over the limit; rejection starts from the next call. Do not rely on 「not even once over」 at the boundary.
21.5 Circuit breaker: reject fast when the target fails continuously
When to use this: the upstream keeps timing out or erroring, and you want later requests to fail immediately instead of every request waiting out the timeout.
Procedure
- On a traffic rule, add the action 「Apply limits」, and expand 「Concurrency, circuit breaker, and timeout (optional)」.
- Turn on 「Circuit breaker」, and fill 「Stats window」 (for example 30 seconds), 「Minimum call samples」, 「Failure-rate threshold」, 「Slow-call threshold」 and 「Slow-call-rate threshold」, 「Open duration」, 「Half-open probes」.
- Save and apply in 「Review this change」.
What you will see
-
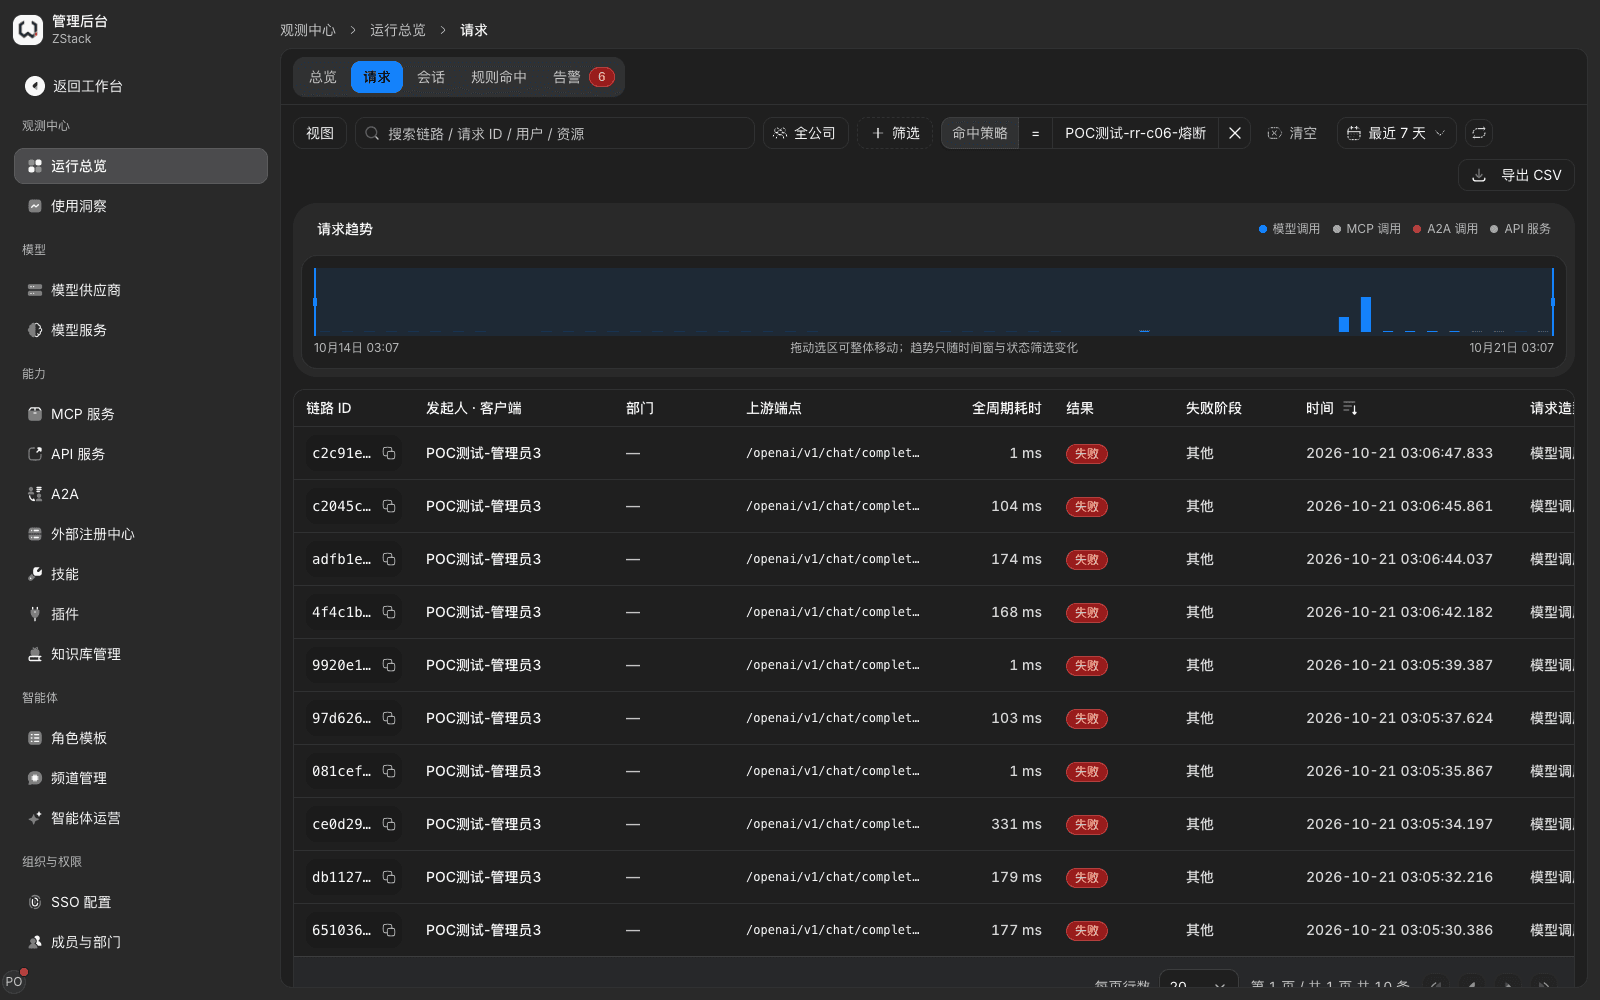
After the breaker opens, the client receives
503:{"error":{"code":"circuit_open","reason":"TRAFFIC_CIRCUIT_OPEN","retry_delay_seconds":29}} -
Requests during the open period have upstream latency 0 ms, which means they were rejected fast and did not bother the upstream again.
-
After the open duration ends, the platform lets a few requests through according to 「Half-open probes」. Successful probes restore it.
Note
- Circuit breaking is a rule-level setting and only applies to requests that match that rule. Disabling the rule restores the original behavior.
- Changing and redistributing a rule resets that rule's breaker state. To check whether it really recovers on its own, wait for the open duration to end without changing configuration, then watch.
- Circuit breaking solves 「do not keep waiting」, not 「the upstream is already healthy」. When it fires often, the root cause is still on the provider side.
21.6 Blocked by a guardrail
When to use this: the call returns 403, but it is neither an available-scope issue nor rate limiting.
Procedure
- Open the request detail and look at the matched rule, category, and action in 「Hit records」.
- Compare the request content with the rule conditions and judge whether it is a false block.
- If it is a false block, adjust the rule's conditions or action (for example change 「Block」 to 「Record only」 and observe for a while). If it is a real violation, tell the caller to change the request content.
What you will see: a guardrail block is 403, the same status as 「available scope not authorized」. The difference is that Hit records show the concrete guardrail category and action.
Note
- Guardrail detection and actions are both written on traffic rules. There is no separate guardrail-configuration page.
- An outbound guardrail blocks the body the model returned, so the same request may already have produced upstream cost while the caller got
403. Check cost against usage in the request detail.
21.7 Upstream errors and failover
When to use this: the request reached the upstream, but the upstream returned an error, could not be connected, or timed out.
Prerequisites: the model has at least two usable upstreams, or the rule is configured with more than two usable targets.
Procedure
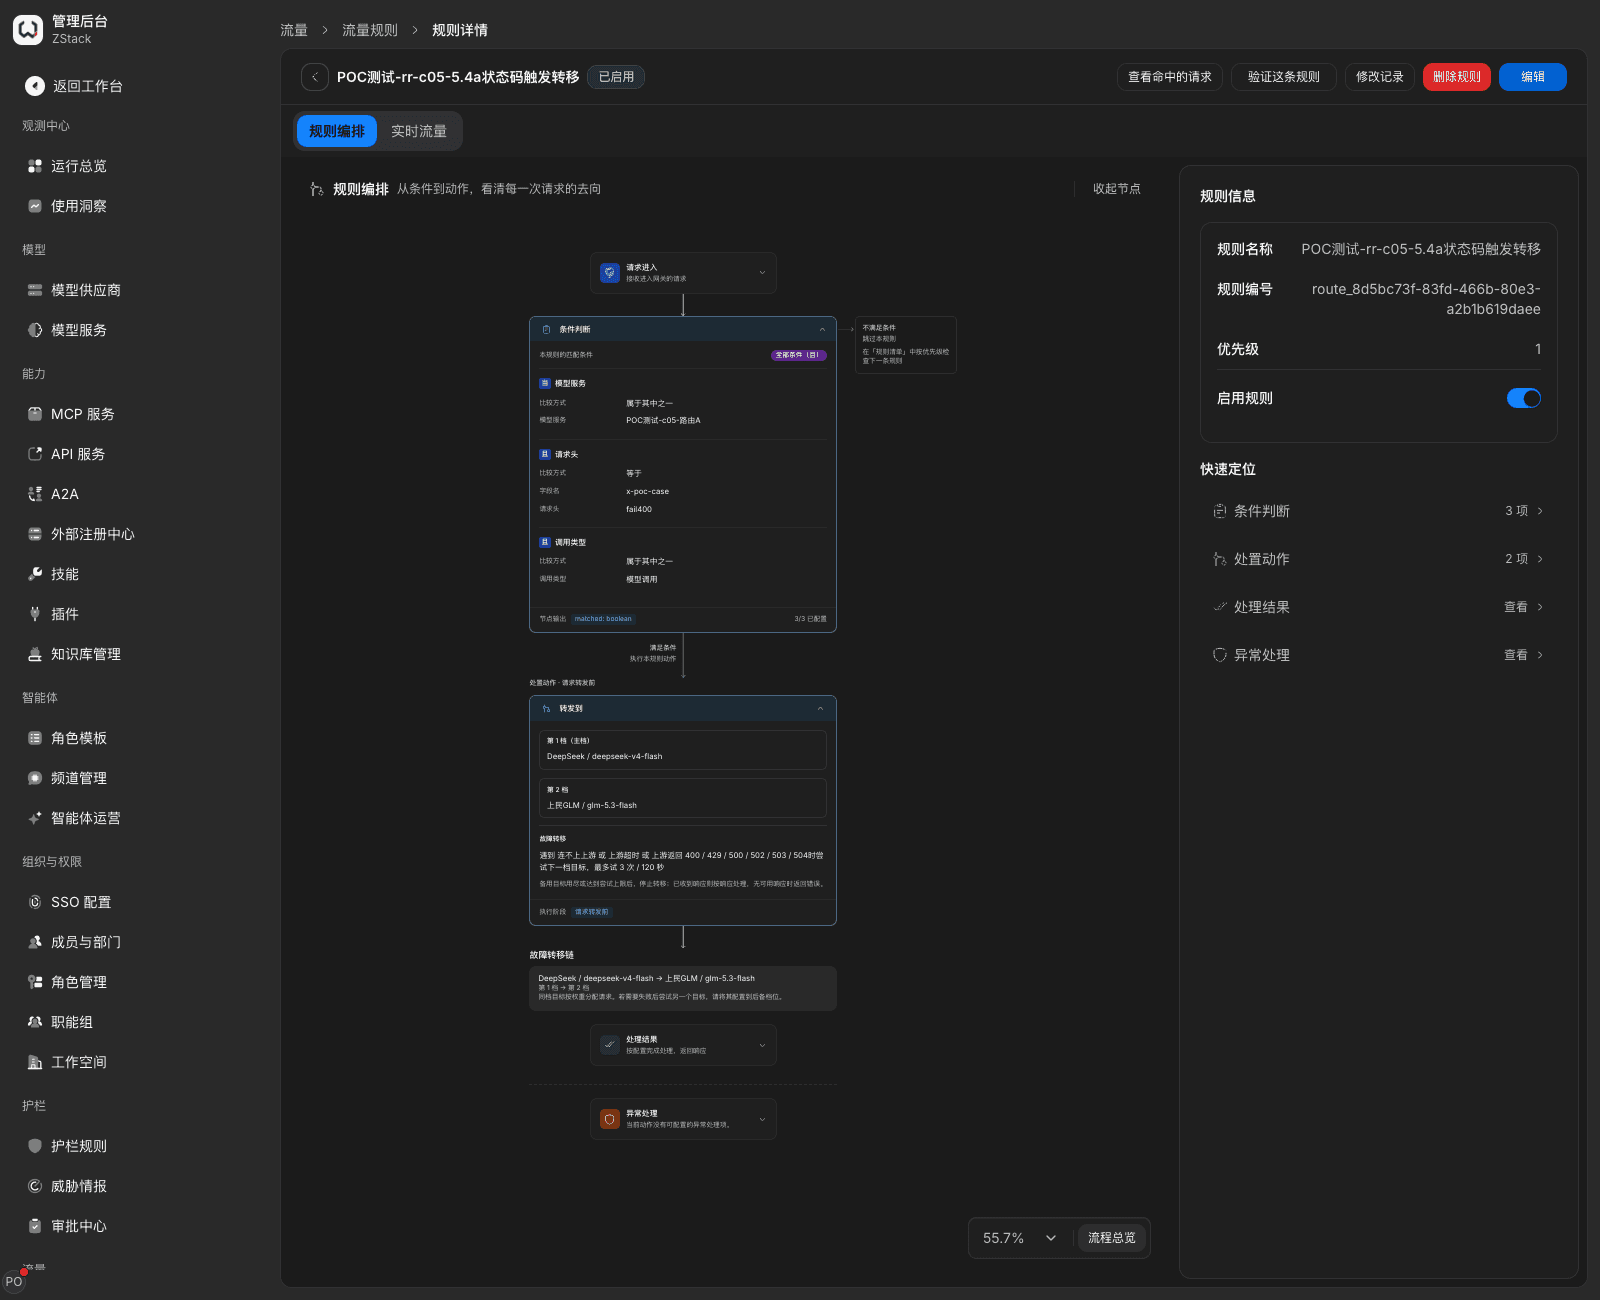
- Open the traffic-rule detail. In 「Rule workflow」, set the forward action to 「Forward to」 and enable 「Failover (high availability)」.
- Order targets by priority: tier 1 is primary; from tier 2 on they are backups.
- Tick trigger conditions: upstream connect failed or interrupted, upstream timeout, and upstream status codes (
400,429,500,502,503,504). - Fill max attempts and a time cap (for example at most 3 times, 120 seconds), save, and apply.
What you will see
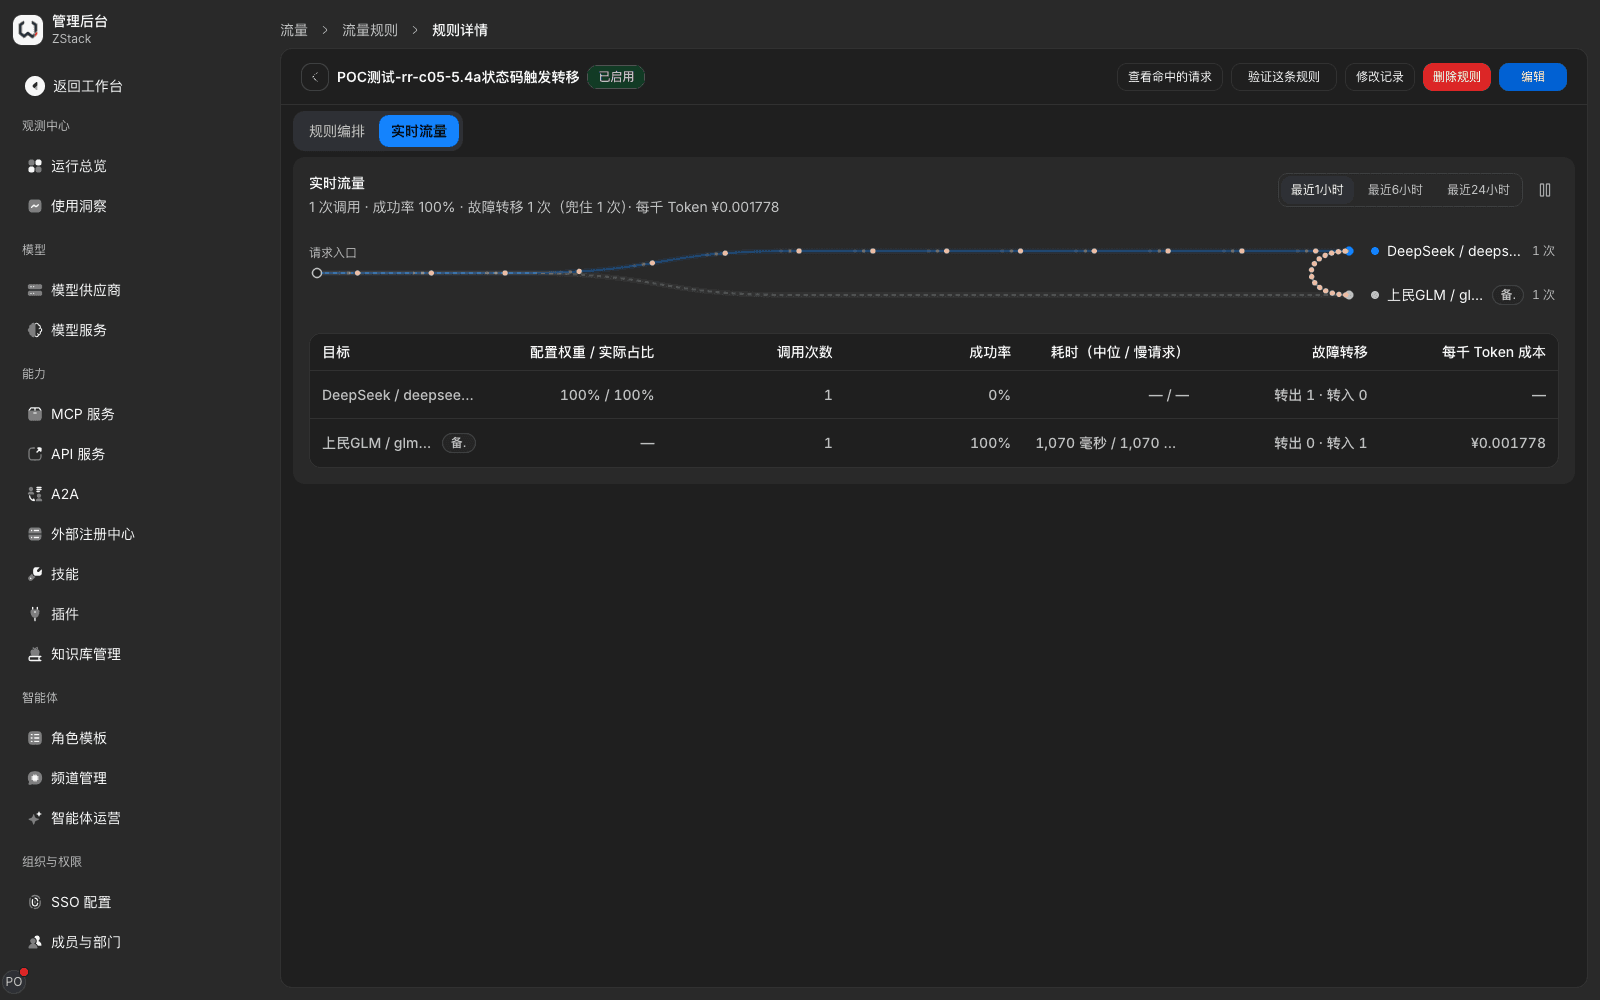
- When the primary fails and a backup succeeds, the client gets
200. The response hasx-zenova-route-rule, and the response-bodymodelfield is the backup model that actually served. - When the failure status is not in the trigger set, the client receives that status as-is. The error body has
details.upstream_statusandupstream_message. That means the platform neither retried nor switched target. - 「Rule workflow」 expresses failover as a chain (tier 1 → tier 2), and states 「After backup targets are exhausted or the attempt cap is reached, stop transferring. If a response was received, handle it as the response; if there is no usable response, return an error」.
- 「Live traffic」 shows each rule's call count, success rate, and 「Failed over N times (caught N)」. Each target row gives transferred-out, transferred-in, and cost. The same call leaves one attempt record on each of the two tiers, one out and one in.
Note
- For parameter-error requests such as
400, retrying on a backup target fails the same way. Whether you put it in the trigger set depends on the backup target's parameter constraints. If you are not sure, do not tick400. - The original upstream error may be passed through to the caller in
details.upstream_message, which can contain an upstream-side request identifier. Watch that when you share request records externally.
21.8 Common error codes and handling
Under the same status code, reason decides who is responsible.
| Status | reason | Scenario | Handling |
|---|---|---|---|
401 | LLM_AUTH_FAILED | The key is invalid, deleted, or disabled | Use a valid key; an administrator checks key status |
403 | PERMISSION_DENIED | Not in available scope, or rejected by a rule | Check available scope; confirm the rule in 「Hit records」 |
404 | LLM_MODEL_NOT_AVAILABLE | The model is not in the services available to this key | Use the correct model name |
400 | LLM_REQUEST_BODY_INVALID | Request-body structure is invalid | The error body has param and field_violations; fix by the field hints |
400 | LLM_UPSTREAM_CLIENT_ERROR | The upstream judged the request illegal (for example a parameter out of range) | Fix parameters from details.upstream_status and upstream_message |
400 | VALIDATION_FAILED / token_limit_input_exceeded | Input tokens exceeded the rule cap; deniedBy is routePolicy | Shorten the input, or adjust the token cap on the rule |
413 | LLM_PAYLOAD_TOO_LARGE | Request body too large | Shrink the body; to raise it, adjust 「Per-request body size limit」 |
429 | TRAFFIC_RATE_LIMITED | Local limit | Wait for Retry-After, then retry; raise the limit if a higher quota is needed |
429 | TRAFFIC_QUEUE_TIMEOUT | Queue wait timed out | Lower concurrency or raise max wait; raise the limit if it is chronically insufficient |
503 | TRAFFIC_CIRCUIT_OPEN | The target is circuit-open | Wait for retry_delay_seconds; investigate the root cause or enable a backup tier |
504 | LLM_TIMEOUT | Upstream timeout | See 21.3 |
502/503 | Upstream-unavailable class reason codes | Upstream fault or unreachable | Handle as in 21.7 and check provider health |
General rules
- Every response has
x-request-id. OpenAI and Gemini error bodies also haverequest_id; Anthropic's is indetails. x-should-retry: falsemeans retry is pointless.429hasRetry-After; back off by those seconds.- The error body contains no upstream address, upstream key, or stack. You can pass it to the caller or an external collaborator as-is.
Note: for errors caused by request content such as 400 and 413, changing gateway configuration does not help. Fix the caller's request first.
21.9 Find systemic issues with Usage insights
When to use this: one-off failures are already handled, but the same class of problem keeps appearing, or you need to answer 「where did calls go poorly in the last two weeks」.
Prerequisites: the account is a tenant administrator; there is session data that went through the gateway.
Procedure
- Open 「Admin Console › Usage insights」. 「Overview」 opens by default. Choose a stats period (for example last 15 days).
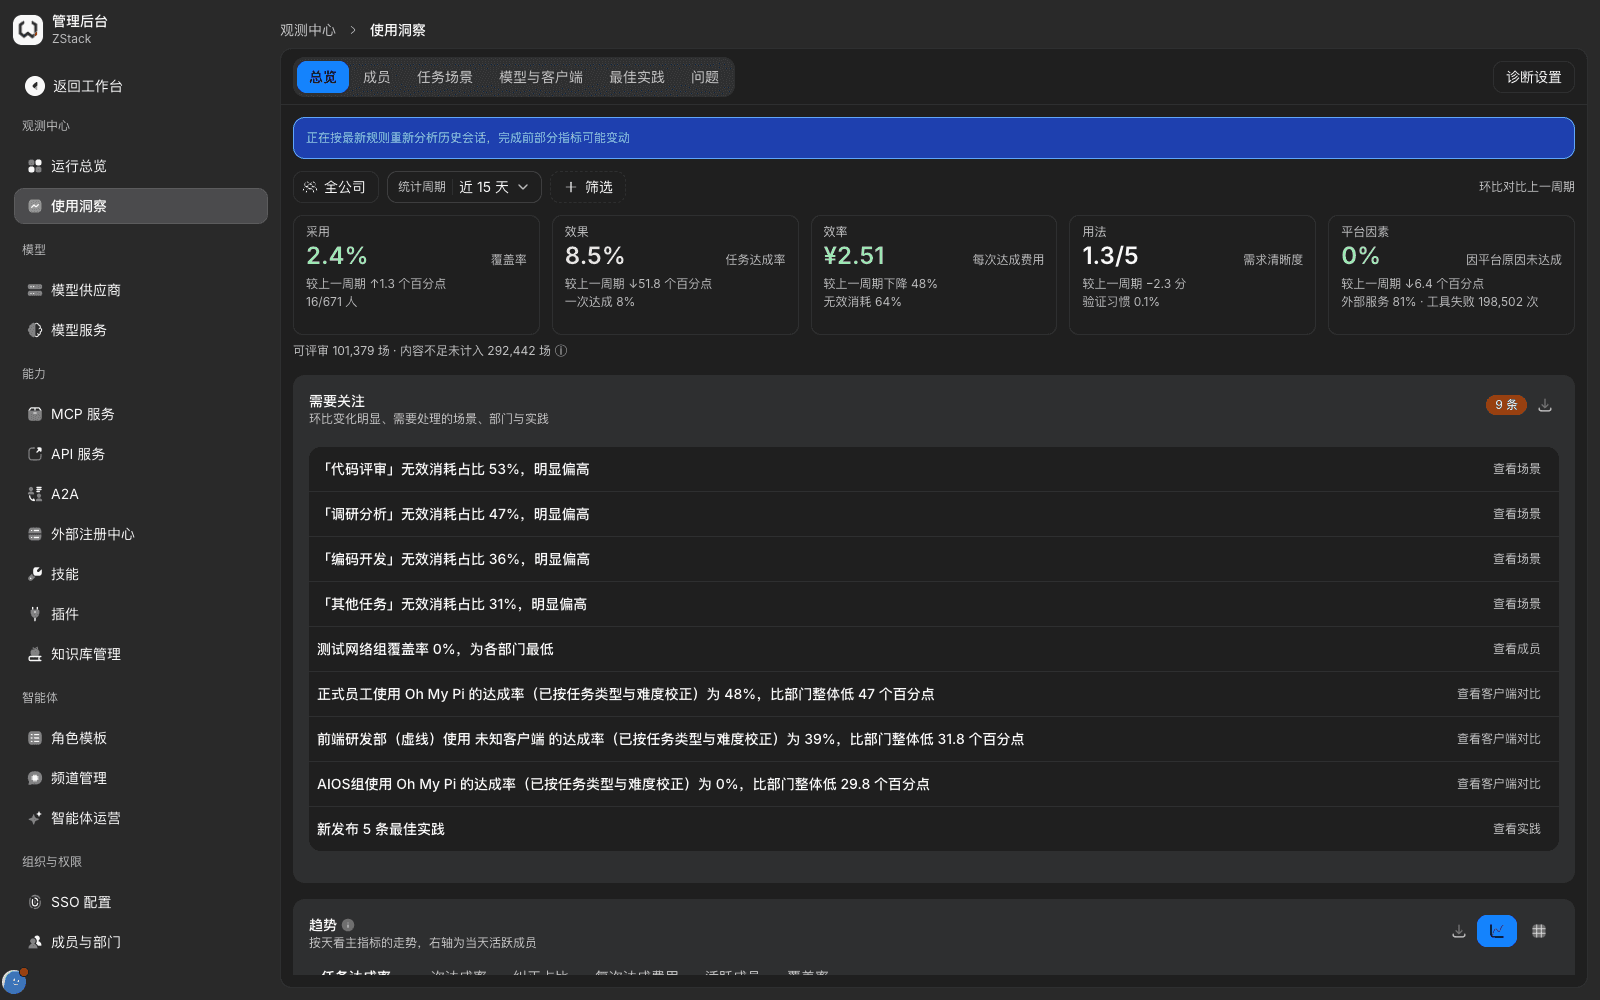
- Look at five metric groups: adoption (coverage), effectiveness (task completion rate, first-try completion rate), efficiency (cost per completion, wasted-spend share), usage (requirement clarity), platform factors (contribution of external-service and tool failures), plus the 「Needs attention」 list and the daily trend.
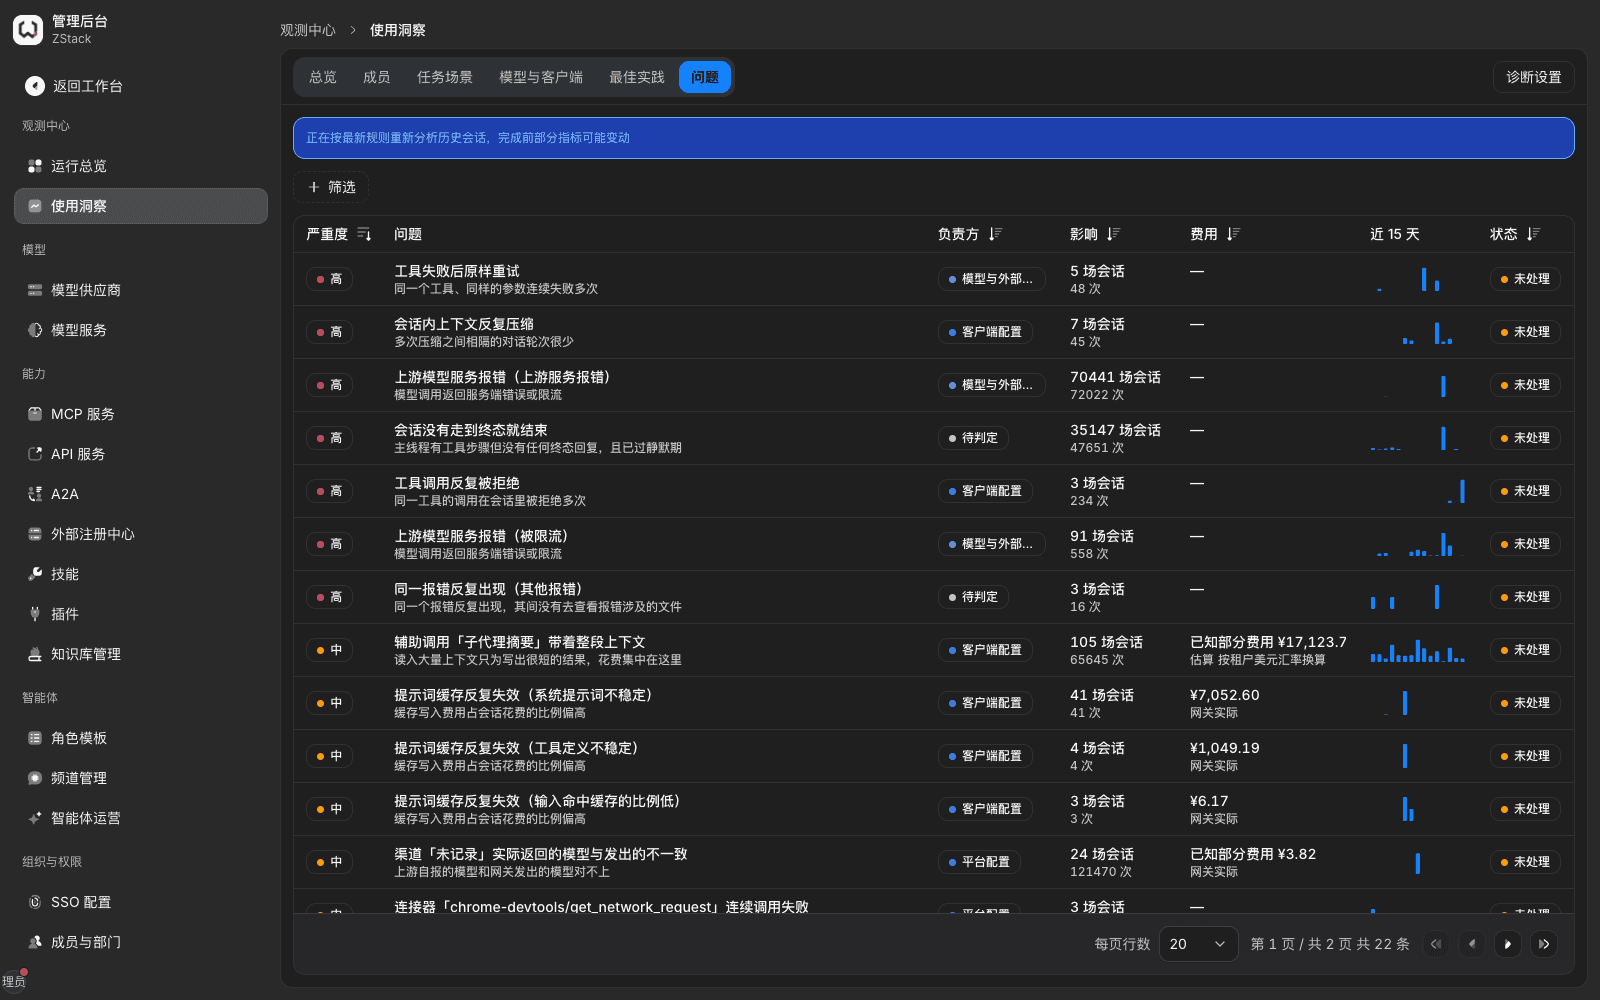
- Switch to the 「Issues」 tab and browse by severity, impact, or cost.
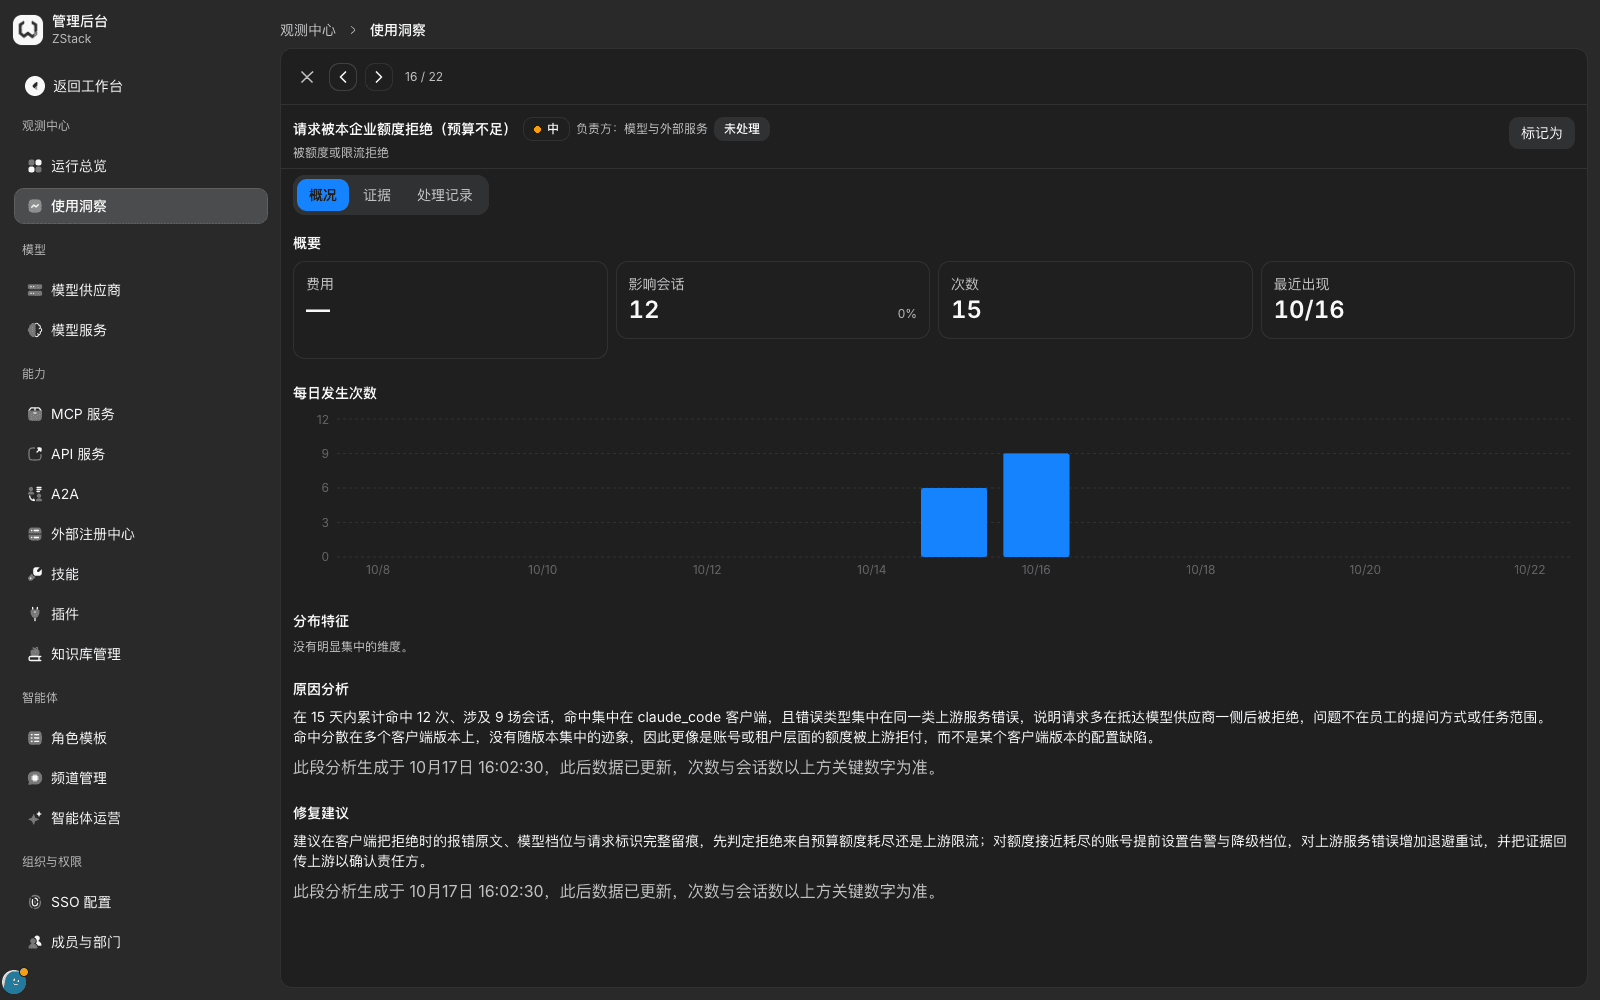
- Open an issue, read distribution features, cause analysis, and fix suggestions in 「Overview」, then use the 「Evidence」 tab to look at matched sessions.
- After handling, click 「Mark as」 to record the disposition status.
What you will see
- The top-right of the page prompts 「Historical sessions are being re-analyzed under the latest rules. Some metrics may change until that finishes.」
- Issue-list columns: severity, issue, owner, affected sessions, count, cost, last-15-day trend, status. Common issues include upstream service errors (including being rate-limited), requests rejected by this organization's quota (budget insufficient), context compressed repeatedly inside a session, prompt cache failing repeatedly, and similar.
- Issue detail gives cost, affected sessions, count, last seen, a daily-occurrence chart, and distribution features by client, error category, and similar dimensions.
- Cause analysis and fix suggestions end with 「This analysis was generated at such-and-such time. Data after that has been updated. Use the key numbers above for count and sessions.」
- The 「Evidence」 tab lists matched sessions: what they were doing, employee, department, hit count, time.
Note
- The first open takes a long time to finish analysis. The page fills data gradually; you do not need to refresh repeatedly.
- Diagnosis aggregates across sessions as an 「issue」. A one-off failed call does not become an issue on its own. To investigate a single call, use the methods in 21.1 through 21.8.
- Cause analysis is a conclusion at one point in time. Later data changes are not written back. When you quote it, use the key numbers and note the time.
- 「Mark as」 changes a disposition status others can see. When several people share a tenant, confirm with colleagues first.
Capability notes
| Capability not provided | What to do instead |
|---|---|
| Automatic diagnostic issues of the 「parameter error」 class | In 「Operations overview › Requests」, filter by status 400 or 422 and look at param and field_violations (see 21.8) |
| Enter and leave overload protection by CPU or memory watermarks | 「Apply limits」 provides concurrency, circuit-breaker, and timeout thresholds. Combine Operations-overview concurrency and latency metrics and handle overload by hand |
| Charts of circuit-breaker count, duration, and recovery | Filter 「Requests」 by TRAFFIC_CIRCUIT_OPEN and count |
| A console for quality-score dimensions and human review | Assess reply quality with Usage insights issues, cause analysis, and evidence sessions (see 21.9) |
Previous: 20. Gateway requests, sessions, and root-cause location · Next: 22. Alerts, notifications, retention, export, and operation audit
20. Gateway requests, sessions, and root-cause location
Full-length chapter. Content is checked against the 2026.10 mainline code and the live console; menus and features depend on the current license, account permissions, and delivered environment.
22. Alerts, notifications, retention, export, and operation audit
Full-length chapter. Content is checked against the 2026.10 mainline code and the live console; menus and features depend on the current license, account permissions, and delivered environment.