18. Usage and cost analysis
Full-length chapter. Content is checked against the 2026.10 mainline code and the live console; menus and features depend on the current license, account permissions, and delivered environment.
Back to overview · Full table of contents · Download full PDF
This chapter: for platform administrators, finance, and operations. How to split tokens and cost to model, department, member, and business tag on 「Operations overview」; how to read performance metrics and compare them with client-side records; how to assess prompt-cache savings and locate cache misses; and how to use pricing snapshots and operations reports. View entries and role requirements are in Chapter 17.
A unified scope
Every task in this chapter is done in 「Admin Console › Observability › Operations overview」. Before you analyze, pin the scope so you compare the same batch of data:
| Setting | Where | Notes |
|---|---|---|
| Time range | Toolbar date button | Last 24 hours, last 7 days, last 30 days, this year, or a custom range. Time bounds are computed in the browser display time zone |
| Data scope | Toolbar 「Whole company」 button | In the org tree, choose a department or member (including child departments), or switch to a workspace |
| Call conditions | Toolbar 「Filter」 | Client, model, access credential, end user, tag. After you add them, whole-page metrics converge |
18.1 Read the operations dashboard
When to use this: you need overall scale, success rate, and the main spenders on one page, or you need to report the current period's runtime to others.
Procedure
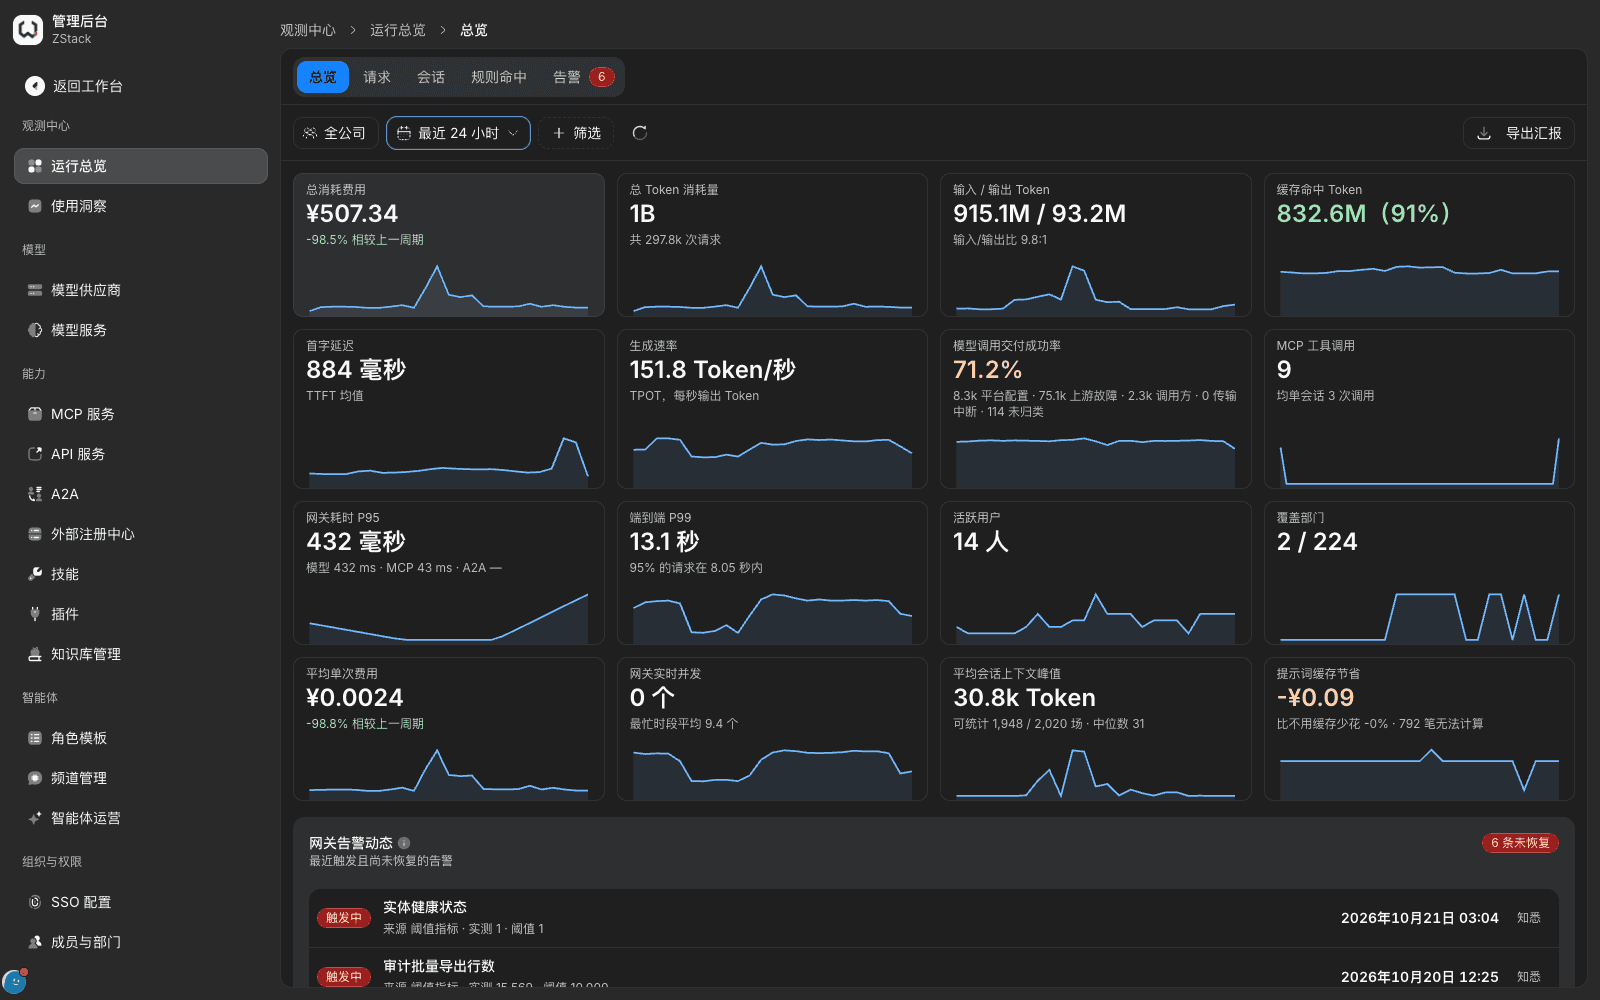
- Open 「Operations overview › Overview」 and choose a time range. Metric cards refresh together with sparkline trends and change versus the previous period.
- Read the top four spend cards in order: Total spend, Total tokens (subtitle is total request count), Input / output tokens, Cached tokens (with hit rate).
- Read the next row of performance cards: Time to first token, Generation rate, Model-call delivery success rate (with five failure attributions), MCP tool calls.
- Read the third row: Gateway latency P95 (split by model, MCP, A2A), End-to-end P99 (subtitle gives 「95% of requests within N seconds」), Active users, Departments covered.
- Read the last row: Average cost per call, Live gateway concurrency (subtitle is average in the busiest interval), Avg session context peak, Prompt cache savings.
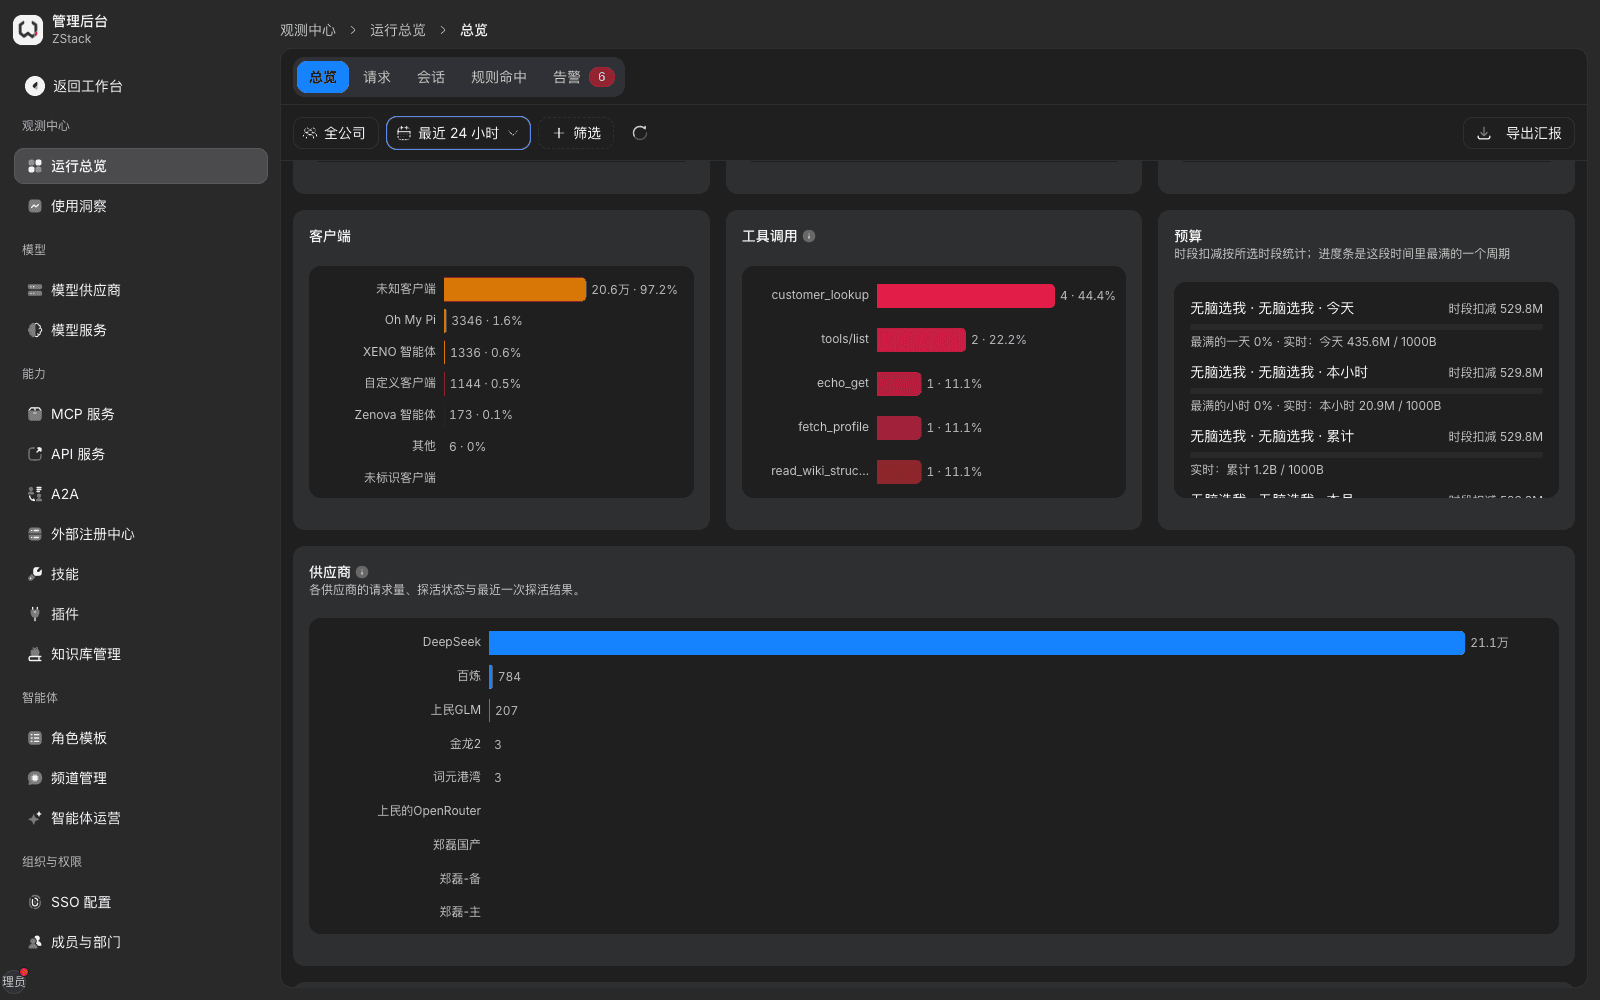
- Scroll down through the remaining panels: client distribution, tool-call ranking, budgets, providers, traffic flow, hourly heatmap, prompt cache by client, reasoning-intensity distribution, response-time distribution.
- When you need to hand the current result to someone else, click 「Export report」 at the top right.
What you will see
- Each metric card's subtitle gives extra notes for that definition. For example, under the success-rate card, failures are split by platform configuration, upstream fault, caller, transport interrupt, unclassified.
- 「Traffic flow」 shows four columns 「Access credential → Client → Model → Provider」. Nodes are annotated with call volume and share of that column. The top right can 「Export CSV」.
- 「Hourly heatmap」 counts request distribution by weekday × hour. Color depth is request volume.
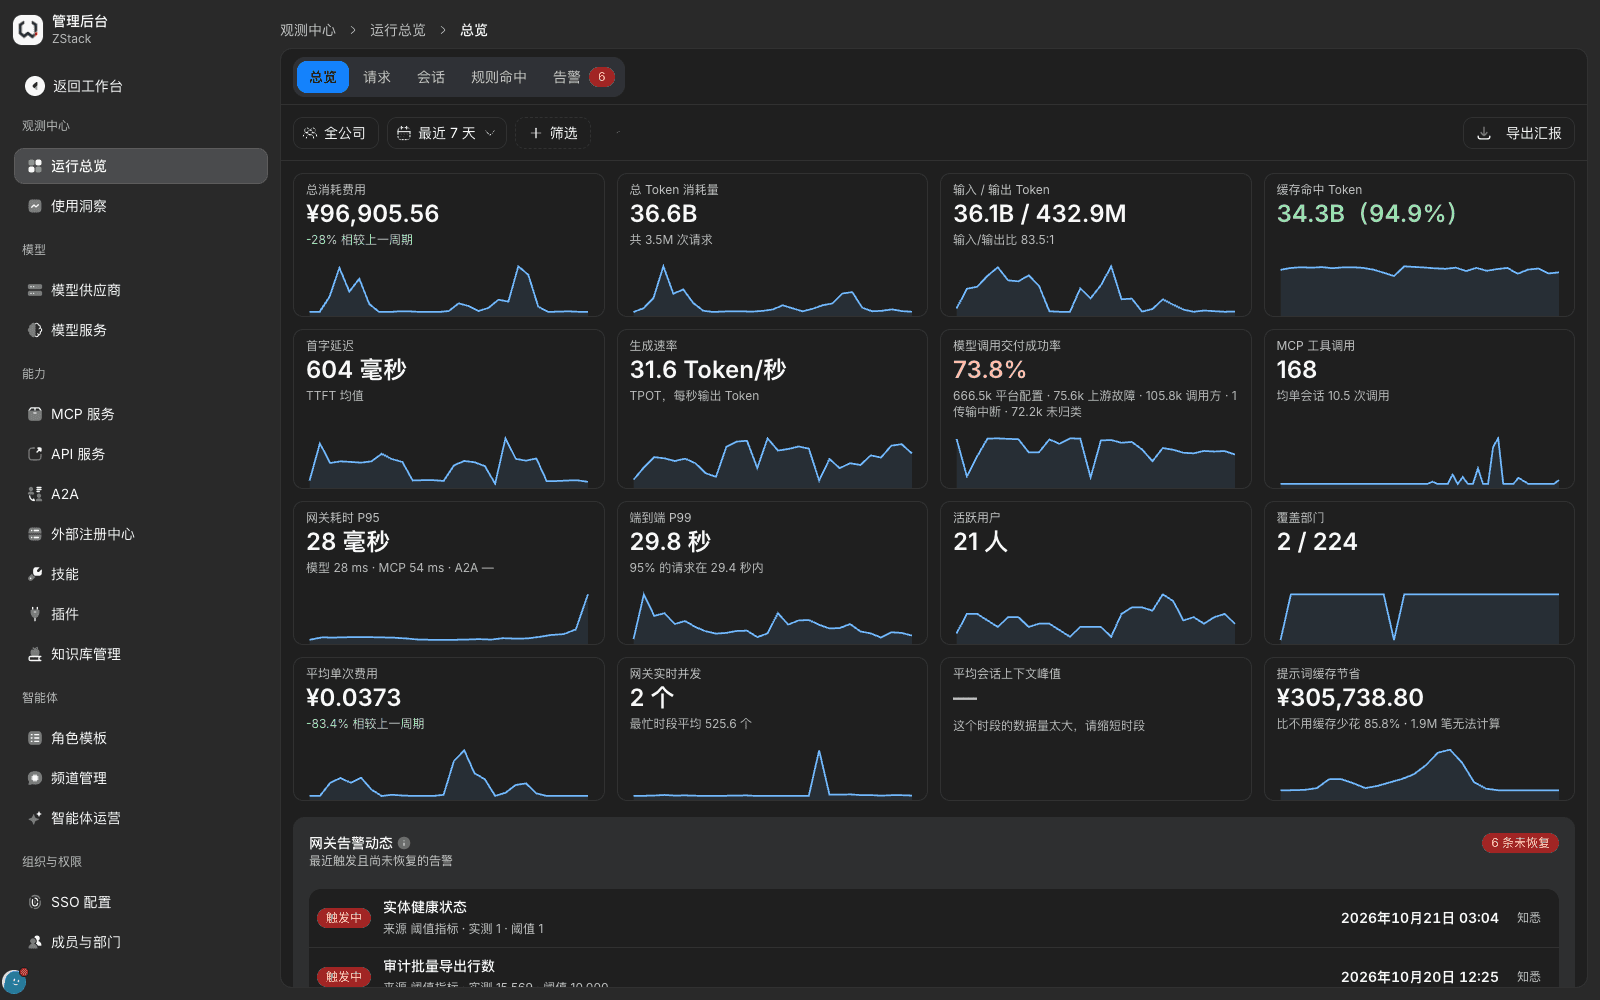
- After you switch the time range, every card and panel changes together.
Note
- Page data refreshes near real time. Numbers between two reads differ because of new calls. When you check, read at the same moment.
- The 「Providers」 panel gives each provider's request volume and the latest connectivity-probe result, by request volume. Together with 「Filter › Model」, you can tell whether a provider is taking the main traffic.
- Metric cards cover all real traffic in the selected range, including long-context and queued requests. They reflect overall experience, not the gateway's own overhead.
18.2 Split the bill by department, project, and tag
When to use this: finance allocation needs to split cost by department or business scenario and produce a bill.
Prerequisites: the account is a tenant administrator; member departments are already maintained in the org tree.
Procedure
- On 「Overview」, read 「Department spend ranking」. Each row gives department name (including parent path) with amount and call count. Calls that could not be attributed show as 「Not attributed to a department」.
- To view by project, click toolbar 「Whole company」, switch to the 「Workspace」 tab, and choose the target workspace. Whole-page metrics converge to that project. Reading 「Total spend」 for each workspace gives the project-dimension amount.
- To split by business scenario, tag calls first (section 17.3), then add 「Tag」 in 「Filter」.
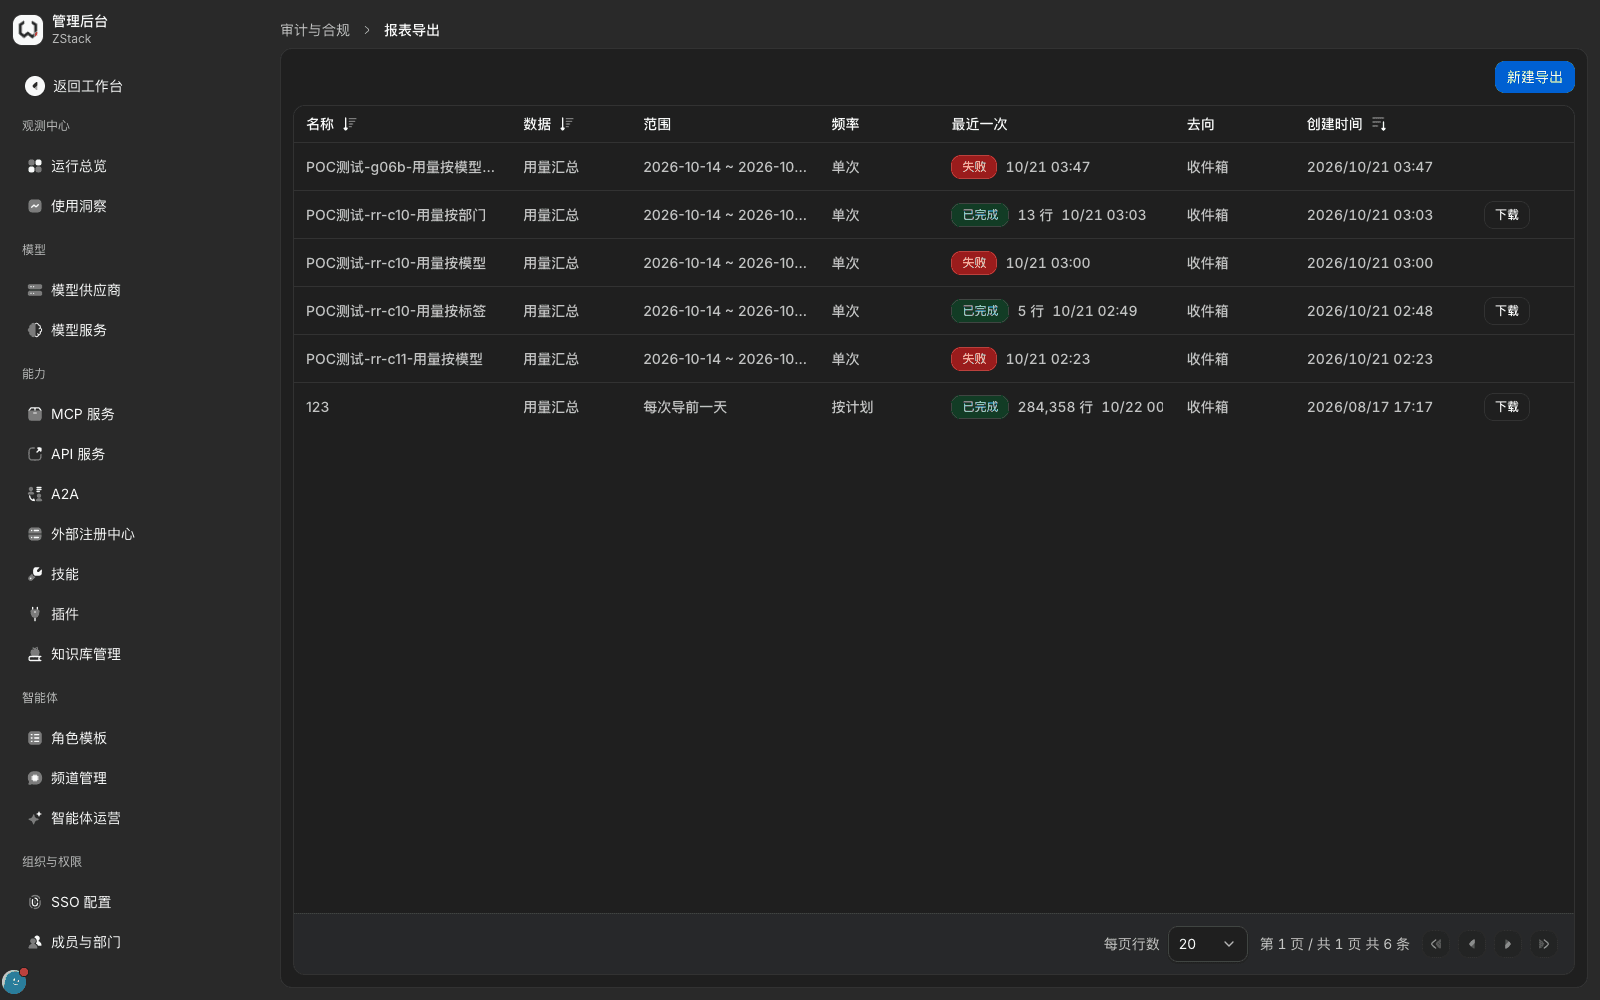
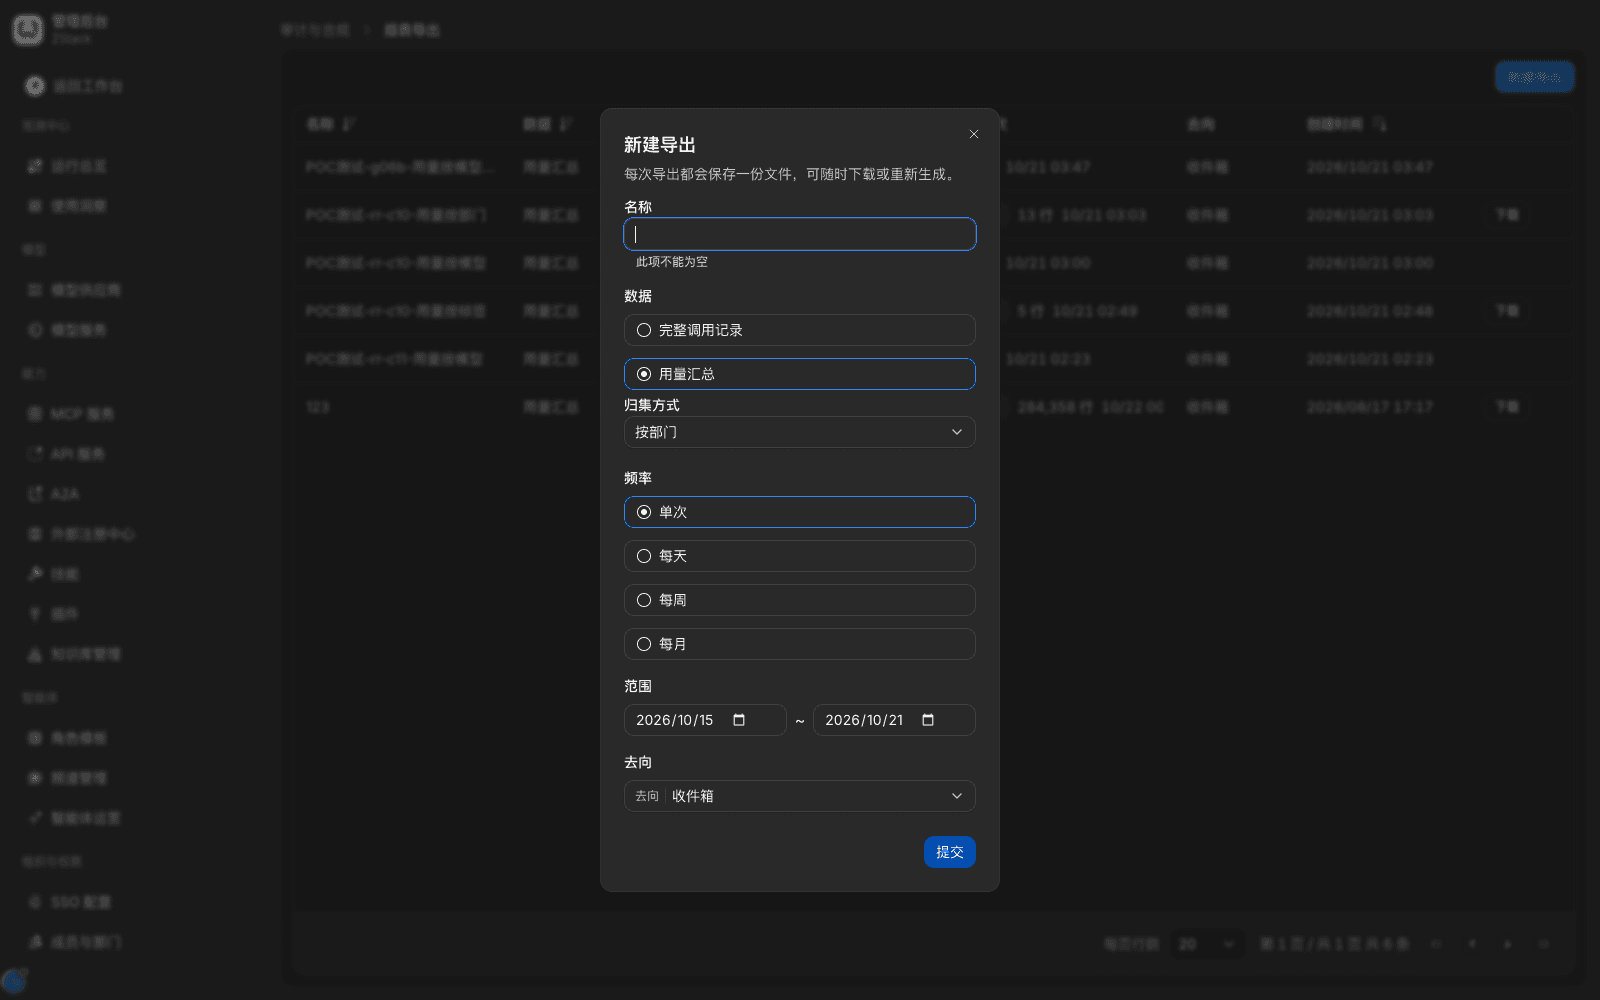
- Produce a billing file: open 「Admin Console › Audit & compliance › Report export」, click 「New export」. 「Data」 「Usage summary」; 「Grouping」 as needed: detail rows, by department, by user, by access credential, or by tag. When you choose 「By tag」, also specify the tag key. Set 「Frequency」 (once / daily / weekly / monthly), 「Range」, and 「Destination」 (Inbox / Object storage / Webhook), then submit.
- After the job finishes, download the file from the list. A scheduled job produces a new file automatically by frequency.
What you will see
- 「By department」 and 「By tag」 usage-summary files have the same headers: grouping object, call count, input tokens, output tokens, cache tokens, cost, currency, stats interval. One grouping object per row, plus one 「Unattributed」 row.
- A department ranking counts a call only once; it is not rolled up to parent departments. The file's definition matches the page.
- Grouping has no 「By model」. To bill by model, export 「Full call records」 and group yourself.
Note
- Department attribution: an API key billed to a department is counted on that department; otherwise it is counted on the user's department. When the user belongs to several departments, it is counted on the deepest common parent of those departments.
- The project (workspace) dimension can only be viewed by switching one by one on the page. There is no side-by-side spend ranking, and you cannot bill by project directly.
- Deleting an export job does not delete already generated files.
- Before a scheduled job produces its first file, 「Last run」 in the list is empty. That is normal.
18.3 Read performance metrics and percentiles
When to use this: you need to tell whether a slowdown is on the gateway side or the upstream side, or to compare platform readings with client-side records.
Procedure
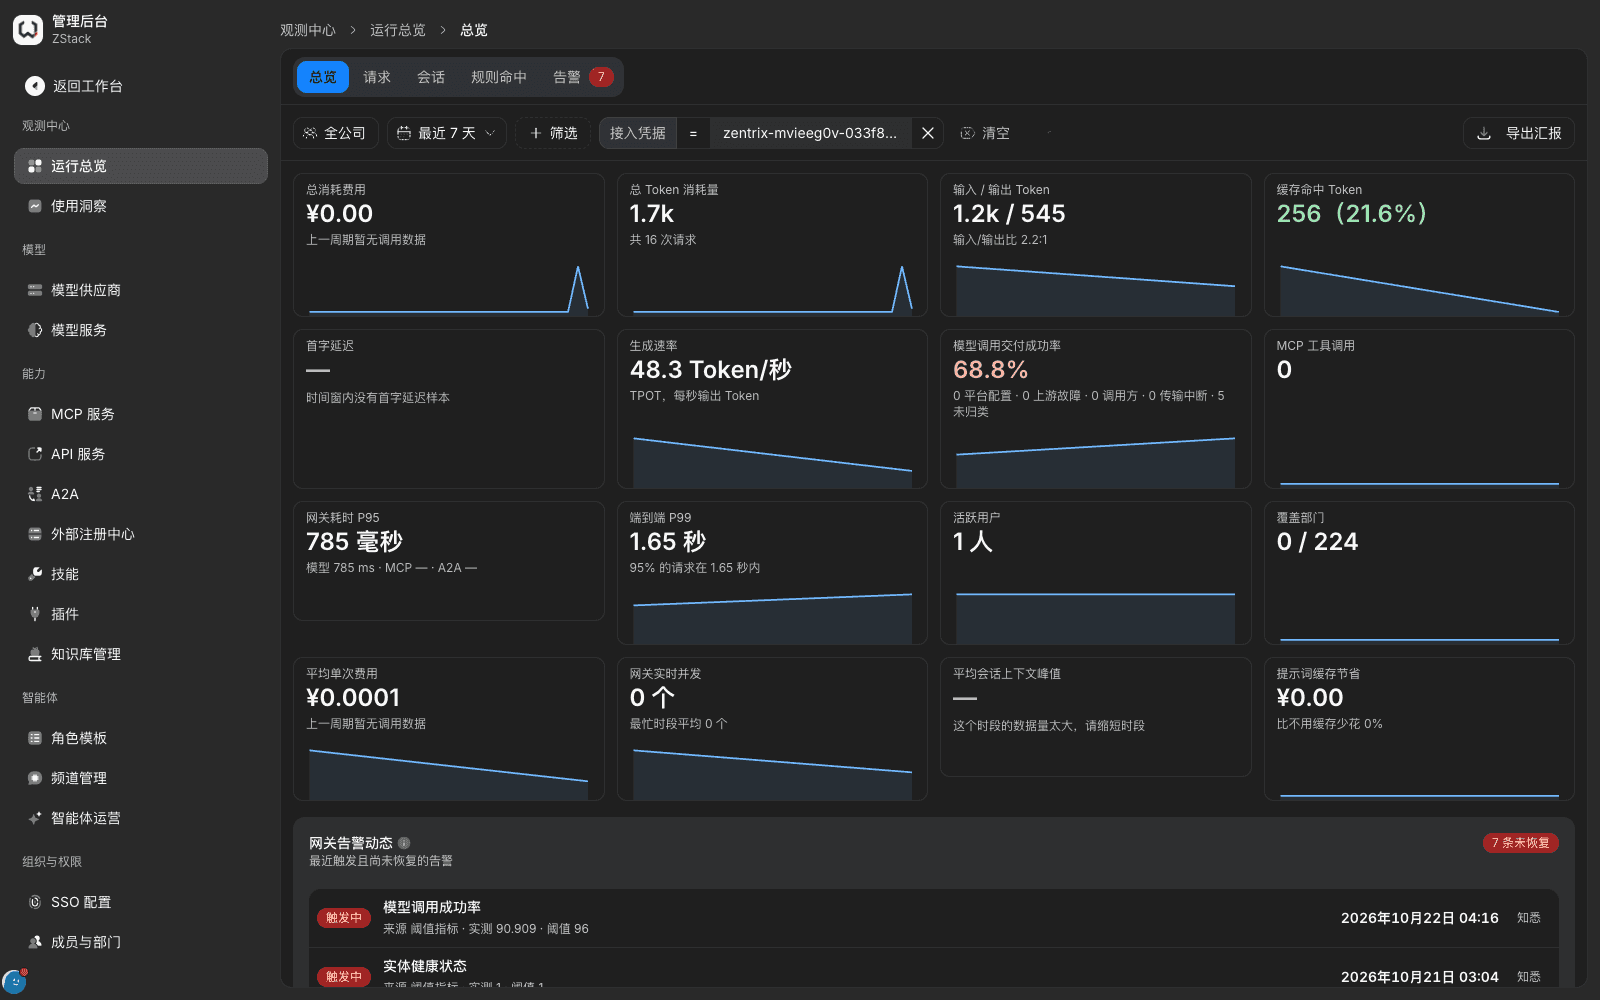
- On 「Overview」, read the performance cards: 「Time to first token」 is the mean TTFT of streaming calls in the window; 「Generation rate」 is output tokens per second; 「Gateway latency P95」 gives model, MCP, and A2A calls separately; 「End-to-end P99」 subtitle gives the 95th percentile.
- Scroll to 「Request latency breakdown」. That panel stacks by upstream (streaming includes generation), failure retry, queue, ingress processing, gateway processing. Each segment is a mean and they can be added. The legend notes the share of requests covered.
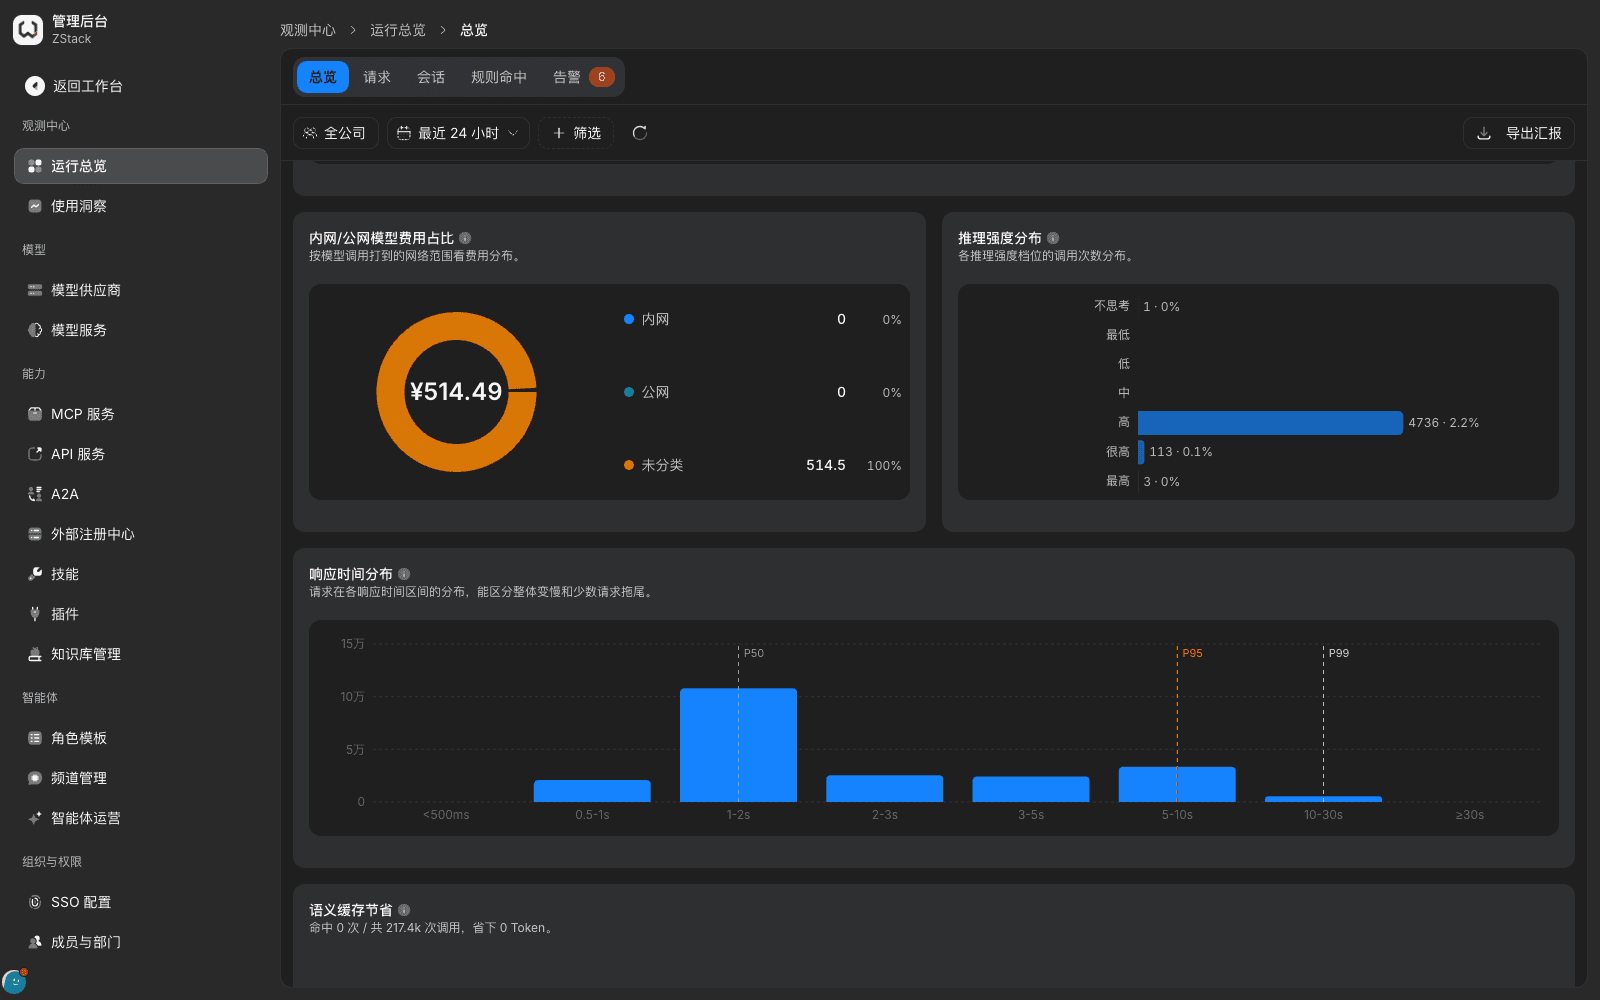
- Scroll to 「Response-time distribution」. The histogram bins <500ms, 0.5–1s, 1–2s, 2–3s, 3–5s, 5–10s, 10–30s, ≥30s, and marks P50, P95, P99 reference lines.
- Scroll to 「Traffic tide and two-way pressure」. The same chart gives gateway QPS, upstream generation tokens/s, and upstream prefill tokens/s.
- To see a caller or a model's performance, add 「Access credential」 or 「Model」 in 「Filter」. Whole-page performance metrics converge.
- To check a single call's latency breakdown, open that call's request-detail 「Latency & outcome」 tab (section 20.2).
What you will see
- 「Request latency breakdown」 separates the gateway's own latency from end-to-end, so you can see directly whether latency growth landed on the gateway or the upstream.
- After you converge to a single caller, you can read that caller's own success rate, time to first token, generation rate, gateway latency P95, and end-to-end P99. When there is no streaming call in the window, time to first token shows 「No TTFT samples in this window」.
Note
- Percentiles appear only on the global 「Response-time distribution」 chart. There is no side-by-side percentile table by model, channel, or project. Time to first token is only a mean, with no percentile.
- The 「Gateway latency P95」 card's definition includes queue time, while the request detail lists queue on its own. When they disagree, use the detail.
- Percentiles swing a lot when the sample is small. Do not draw a capacity conclusion from them.
- Total latency the client measures = gateway total latency + network round trip, handshake, and front proxy between the client and the gateway. The difference reflects the network path, not gateway processing time.
18.4 Analyze prompt-cache hits
When to use this: cost of long-context calls mainly comes from repeated input, and you need to confirm whether cache is working, and why cache keeps missing.
Procedure
- On 「Overview」, read the 「Prompt cache savings」 card: amount and share saved versus not using cache, and the number of calls that cannot be priced.
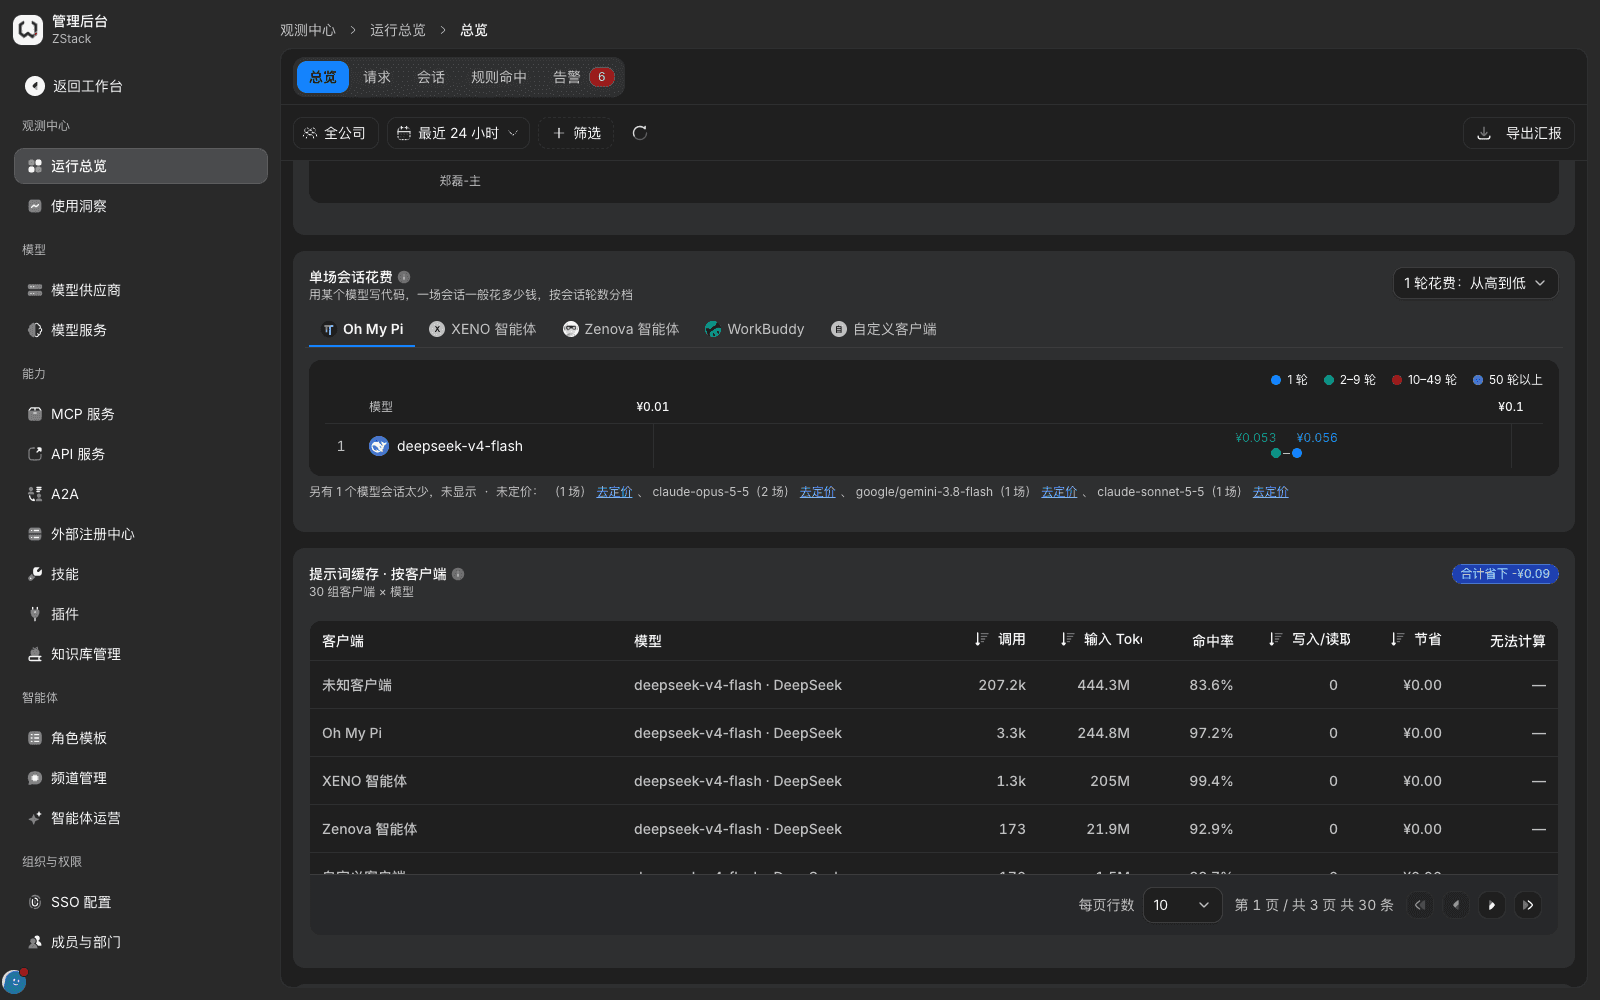
- Scroll to 「Prompt cache · by client」. The table lists call count, input tokens, hit rate, write / read, savings, and cannot-compute, by 「client × model」. The top right gives total savings.
- Sort by 「Hit rate」 and find combinations whose hit rate is clearly low. Hit rate = cache-hit tokens ÷ input tokens.
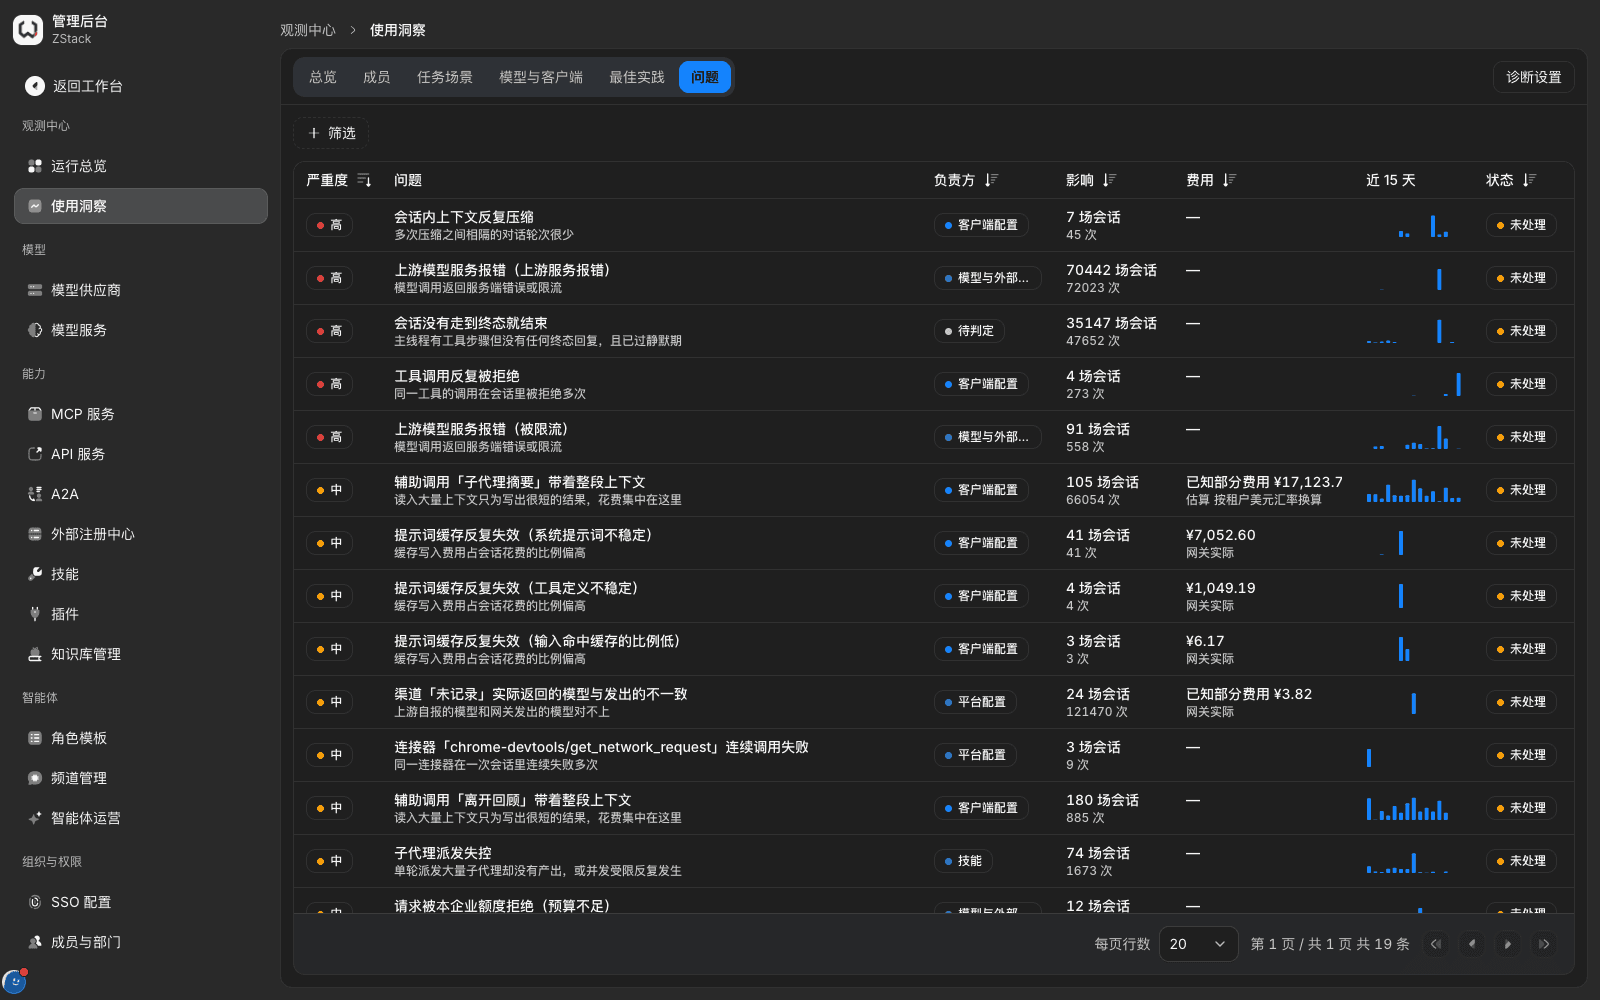
- Sessions whose cache keeps missing are identified automatically by Usage insights: open 「Admin Console › Observability › Usage insights › Issues」 and look for 「Prompt cache failing repeatedly」 issues. The system splits them into three cause classes: unstable system prompt, unstable tool definitions, low share of input that hits cache.
- Click into the issue detail. Read cost, affected sessions, count, daily occurrence, cause analysis, and fix suggestions in 「Overview」. Switch to 「Evidence」 to look at matched sessions.
- After you adjust client configuration as suggested, choose 「Handled, start observing」 in 「Mark as」 at the top right. The system rechecks automatically after the observation period.
What you will see
- Saved amount is listed on its own and is not included in 「Total spend」.
- The 「Cannot compute」 column in the table marks calls that cannot convert savings because they lack pricing. A negative saving means cache-write cost in the period was greater than savings from read hits, common in a window where cache was just built or kept missing.
- Cause analysis in the issue detail names which client the issue concentrates on, and gives a targeted fix direction.
Common fix directions
- Pin the system prompt, and move timestamps, random numbers, and similar volatile content to the end of the conversation;
- Pin field order and serialization format of tool definitions. Sort the MCP tool set by name before you register it;
- Unify versions on the same client, so several versions do not alternately register different tool definitions.
Note
- Cause analysis in the issue detail has a generation time. Data after that is still updating; use the key numbers at the top of the page.
- The 「Evidence」 tab lists matched sessions and counts. It does not locate a miss per request, and it does not show a hash comparison of system prompt and tool definitions.
- Cache stats have no split by endpoint (chat / messages / responses).
18.5 Pricing snapshots and historical bills
When to use this: you agreed with the business to settle at an internal unit price, or you need to explain 「why old bills did not change after a price change」.
Each call is billed at the then-effective unit price when it happens, and that is recorded. After you adjust the unit price, only later calls are billed at the new price. Cost of already produced calls is not recomputed.
Order that decides the effective unit price
- Target-specific price: a price set for an object alone in the model group's 「Visibility & quotas」. When the same call matches several objects, the most specific one wins: user > functional group > department > workspace > all members of this group.
- Provider list price: the price set in the model provider's model pricing (Chapter 5).
Procedure
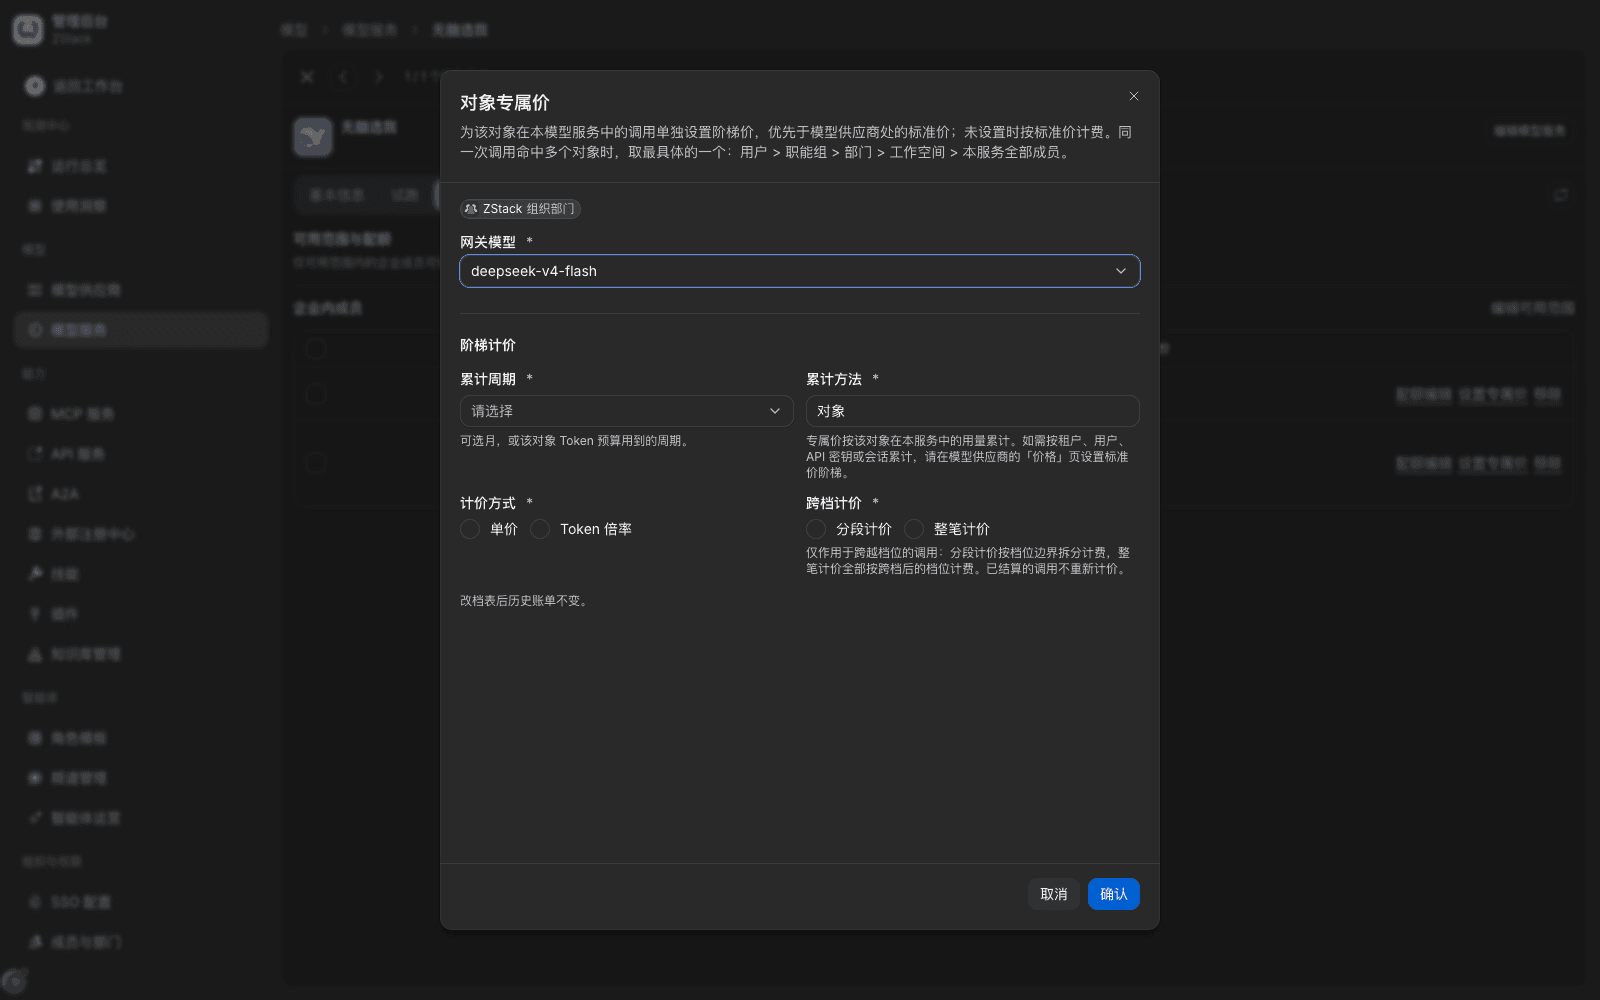
- Open 「Admin Console › Organization & Access › Model Groups」, enter the target group's 「Visibility & quotas」 tab, and on the target-object row click 「Set specific price」.
- Choose the gateway model, accumulation period and method, pricing method (unit price / token multiplier), and cross-tier pricing (tiered / whole-call).
- In tier information, fill usage ranges and input, output, cache-hit, cache-write unit prices (per million tokens). To need a ladder, click 「Add tier」.
- Click 「Confirm」. Later calls are priced on the new tier table.
What you will see
- The dialog notes 「Set a ladder price for this object's calls in this model group, taking precedence over the list price at the model provider」, plus 「Historical bills do not change after you change the tier table」 and 「Settled calls are not re-priced」.
- For a model not priced at the provider, 「Set specific price」 prompts that the model has no list price yet, and provides a 「Set price」 entry.
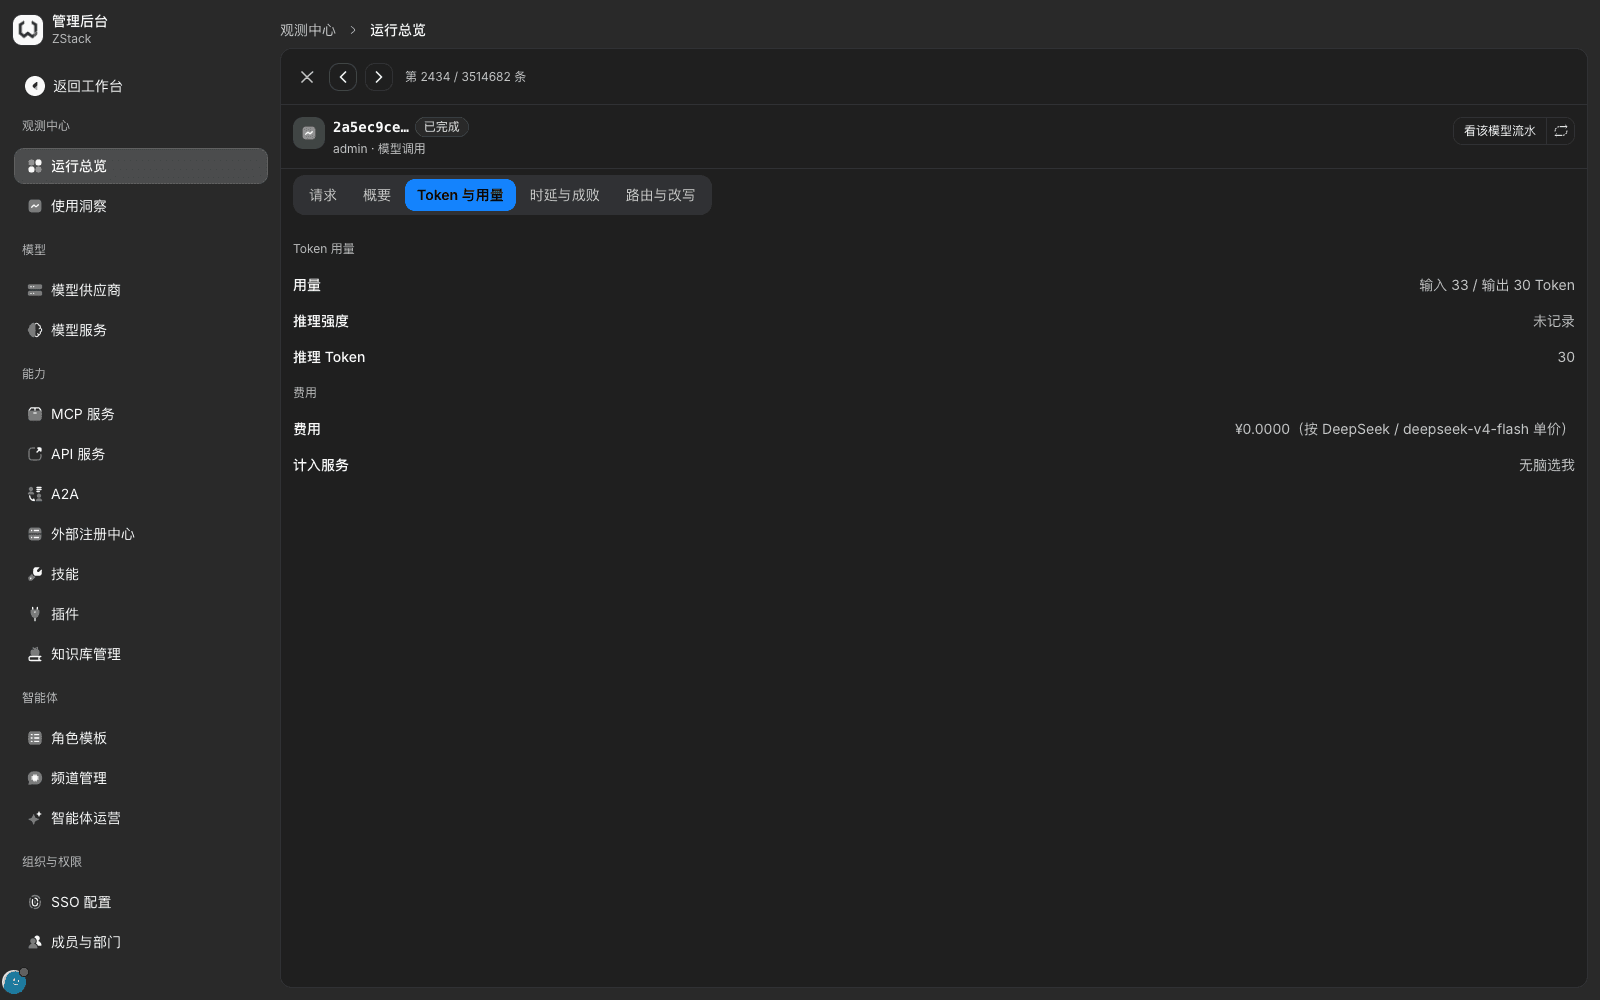
- The cost row of request-detail 「Tokens & usage」 gives this call's cost and the pricing basis.
Note
- After a specific price is saved, it applies immediately to later calls. Cost of historical calls keeps the original value.
- An unpriced model cannot have a specific price. Price it at the provider first.
- A model priced in USD is converted to the settlement currency at the rate in 「Global settings」.
18.6 SLA monitoring and usage forecast
When to use this: you need to tell whether a caller currently meets the agreed success rate and latency.
Procedure
- On 「Overview」, add 「Access credential」 or 「Actor」 in 「Filter」 to converge the whole page to that caller.
- Read that caller's 「Model-call delivery success rate」 and 「End-to-end P99」 as the current-period pass basis.
- For group-dimension data, open 「Model Groups › group detail › Usage」 and look at that group's call volume, success rate, and latency stats.
- To keep a record, use 「Export report」 for the current metrics, or set a scheduled report as in section 18.2, producing a file by day / week / month.
What you will see
- After you converge to one party, success rate, time to first token, generation rate, gateway latency P95, and end-to-end P99 are all that caller's own values.
- The CSV 「Export report」 produces is long format. Columns include partition, project, value, unit, share. Partitions include key metrics, model ranking, client ranking, department allocation. Key metrics match the dashboard item by item.
Note
- The platform provides 「Model-call delivery success rate」 as a metric, but has no SLA-target setting, pass-rate computation, or SLA report. Judging whether it passed needs a human comparison with the agreed value.
- There is no side-by-side comparison table by caller. You can only filter and view one by one.
- There is no usage-forecast curve. For capacity planning, extrapolate by hand from the historical trend of 「Traffic tide and two-way pressure」.
18.7 Operations reports
When to use this: you need to hand runtime data to management, finance, or audit on a schedule.
Procedure
- Current-period snapshot: after you pin the range on 「Overview」, click 「Export report」 to get a CSV of the same range as the metric cards.
- Scheduled reports: in 「Report export」, create a job, set 「Data」 to usage summary or full call records, and set frequency and destination. Files are produced automatically by frequency, landing in the inbox, object storage, or a webhook.
- For operating metrics, compute unit-token cost yourself from 「Average cost per call」 and 「Total tokens」. The dashboard has no ready-made cards of that kind.
Note
- Report export produces files, not a real-time stream. For real-time delivery, see Chapter 19 Capability notes.
- 「Export report」 reflects data at the moment you click. The dashboard you open afterwards may differ slightly.
Capability notes
| Capability not provided | What to do instead |
|---|---|
| A usage-summary export grouped by model | A job grouped by model may fail to run. Export 「Full call records」 instead and group by the model field (section 18.2) |
| Spend ranking and billing by workspace or functional group | Switch 「Data scope › Workspace」 one by one and read the amount. When you need a file, export detail rows and summarize yourself |
| A side-by-side percentile table by model, channel, or project, plus P90 and TTFT percentiles | Narrow one by one with 「Filter」 and read P95 / P99, or export call records and compute yourself (section 18.3) |
| A peak-QPS number card | Read the QPS trend in 「Traffic tide and two-way pressure」 and take the highest point (section 18.3) |
| SLA-target setting, pass rate, and an SLA report | Converge to that caller with 「Filter」, read success rate and P99, compare with the agreed value by hand, and keep a record (section 18.6) |
| Usage forecast | Extrapolate by hand from the historical trend of 「Traffic tide and two-way pressure」 (section 18.6) |
| An operations wall / full-screen display mode | Use the 「Operations overview」 page, or export a report on a schedule (section 18.7) |
| Operating-metric cards such as unit-token cost and compute utilization | Compute yourself from total spend and total tokens in 「Export report」 (section 18.7) |
| Per-request cache-miss location and prompt-hash comparison | Handle from Usage insights cause classes and fix suggestions, and compare adjacent requests' system prompts and tool definitions (section 18.4) |
Previous: 17. View usage and control cost · Next: 19. Observability entries, data sources, and permission boundaries
17. View usage and control cost
Full-length chapter. Content is checked against the 2026.10 mainline code and the live console; menus and features depend on the current license, account permissions, and delivered environment.
19. Observability entries, data sources, and permission boundaries
Full-length chapter. Content is checked against the 2026.10 mainline code and the live console; menus and features depend on the current license, account permissions, and delivered environment.