23. Platform runtime and day-to-day maintenance
Full-length chapter. Content is checked against the 2026.10 mainline code and the live console; menus and features depend on the current license, account permissions, and delivered environment.
Back to overview · Full table of contents · Download full PDF
This chapter: for operations staff, platform administrators, and tenant administrators who need to understand how the platform runs. It covers: how to tell whether the platform is healthy, the control-plane versus data-plane boundary, maintaining gateway nodes and ingress, backup, restore, and upgrade, emergency disable, parameter tuning, and multi-node high availability.
About downtime and global impact: operations in this chapter that involve downtime, restart, or cutover affect members and callers who are using the platform. Before you run them, confirm the blast radius (who is affected), downtime (how long is acceptable), and verification (how you confirm recovery), and run them in a maintenance window. Operations the tenant console cannot complete are done on the platform side.
| Entry | Page | Who it is for |
|---|---|---|
Public page /platform-status | Platform Status | Anyone; no sign-in |
| Admin Console | Operations overview; gateway domain (from the gateway hint bar on a session detail) | Tenant administrator |
| Platform console | Gateway nodes (including node logs), egress proxy, Runtime monitoring, System maintenance (System Updates, Backup & Restore) | Platform administrator |
| Command line | zenova status, zenova doctor | Platform administrator |
23.1 Tell whether the platform is healthy
When to use this: duty handover, daily inspection, or a question of 「is the platform down」.
- Open the Platform Status page
https://<网关地址>/platform-status. It is public, needs no sign-in, and is suitable for a duty handbook or a monitoring wall. - Sign in to the Admin Console and look at data-plane metrics and recent alerts on 「Operations overview › Overview」. To look at the deployment itself, a platform administrator opens 「Runtime monitoring」 on the platform console.
What you will see: Platform Status lists a 24-hour probe timeline per component (database, authorization service, container runtime, identity, model gateway, analytics, object storage, and similar, according to what the deployment actually includes). Green is healthy; red means that interval was unhealthy. Operations overview gives gateway latency, live concurrency, and the request-result breakdown. Cards such as 「Avg session context peak」 prompt 「Too much data for this period — pick a shorter one」 when the range is too large; switch to 24 hours and it displays. That is a protection prompt, not a fault.
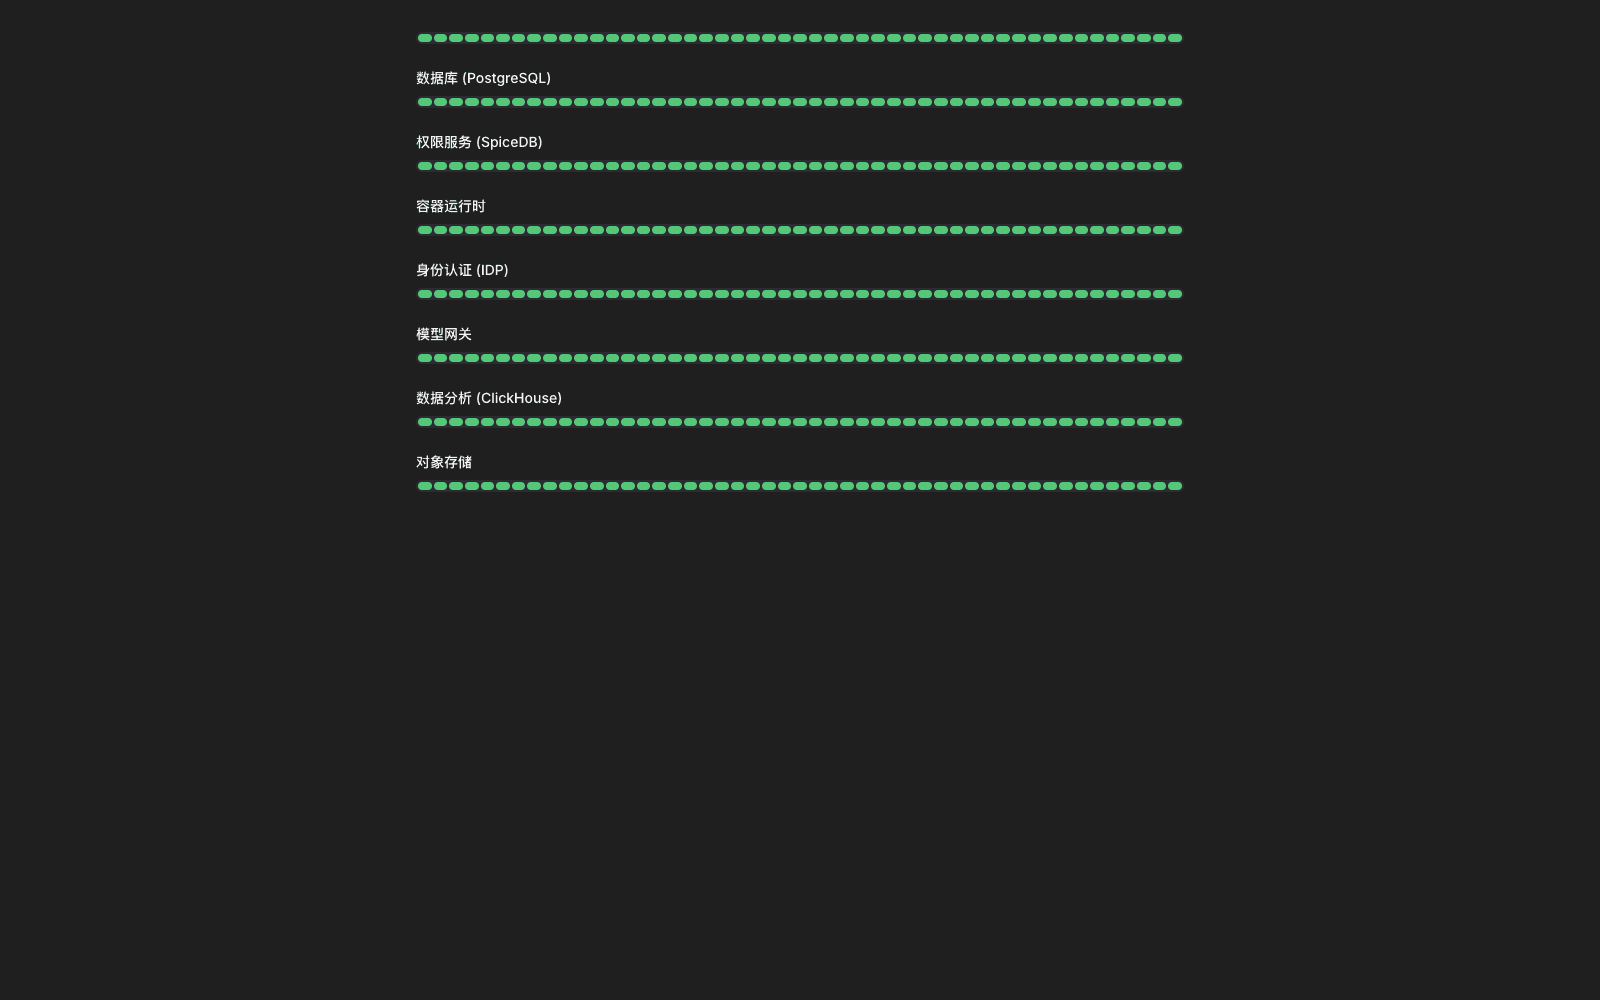
What a tenant can see: component probes, gateway latency and concurrency, request-result breakdown, alert rules and events. The gateway-node list, configuration lag, ship-back backlog, host-capacity alerts, backup and upgrade, and egress proxy belong to the platform console and are owned by the platform side.
23.2 Control-plane versus data-plane responsibilities
When to use this: planning a maintenance window, or the console will not open while business still runs, and you need to tell which kind of fault it is.
| Control plane | Data plane (gateway nodes) | |
|---|---|---|
| What it does | Admin Console, management APIs; save and distribute configuration; background tasks | Receive business calls; authenticate, rate-limit, route, guard, forward |
| When it is unavailable | The console will not open; configuration cannot be changed | Calls fail |
| Depends on | Platform database, authorization service, identity | Configuration and snapshots already on local disk; does not depend on the database |
The control plane runs active/standby. The primary keeps identity with a 45-second lease; after it expires, another replica takes over. While the control plane is unavailable, gateway nodes keep handling calls with the last distributed configuration, and already issued API keys still work — a short control-plane restart does not interrupt business. Calls also keep forwarding when the analytics database is unavailable; details are kept locally and backfilled after recovery.
Note
- 「The console will not open」 and 「calls do not go through」 are two fault surfaces. The former usually does not affect business; the latter always does. Separate them first when you report an incident.
- The data plane can run without the control plane only if the node already has usable configuration. A new node that has never successfully connected to the control plane does not have that ability.
- The product does not give a unified RTO or RPO commitment. Cutover time and data loss depend on the deployment topology and the database plan; use the rehearsal result in the customer environment.
23.3 Gateway nodes and ingress
When to use this: adding a node to share traffic, node maintenance, changing the ingress domain and certificate. Node operations are done by a platform administrator in 「Gateway」.
| Item | Notes |
|---|---|
| Heartbeat judgement | Nodes report periodically; fresh within 30 seconds; not reported for more than 120 seconds is judged offline and alerts |
| List fields | Node name, status, region, version, ingress pool. 「Node address」, 「Config revisions behind」, 「Last heartbeat」 are opened in 「Columns」. You can filter by lifecycle, region, ingress pool, offline |
| Configuration lag | Lag of more than 2 revisions triggers a 「configuration behind」 alert |
Drain and retire: in the node detail, choose 「Drain」. The node stops accepting new requests and waits until in-flight requests (including streaming responses), the ship-back backlog, and local staging are empty. You can 「Cancel drain」 at any time. At the same time, have the network administrator take it out of DNS or the load balancer. After drain completes, choose 「Retire」. Forced retire revokes the node's instance identity and discards records not yet shipped back and local staging; use it only when you confirm the node will not be restored.
Scale out: click 「Add node」, fill node name, address, region, reconnect address, and install method, get a one-time install command (valid 24 hours), and run it on the target host. After it comes up, 「Join ingress pool」 and pass self-check before it takes traffic.
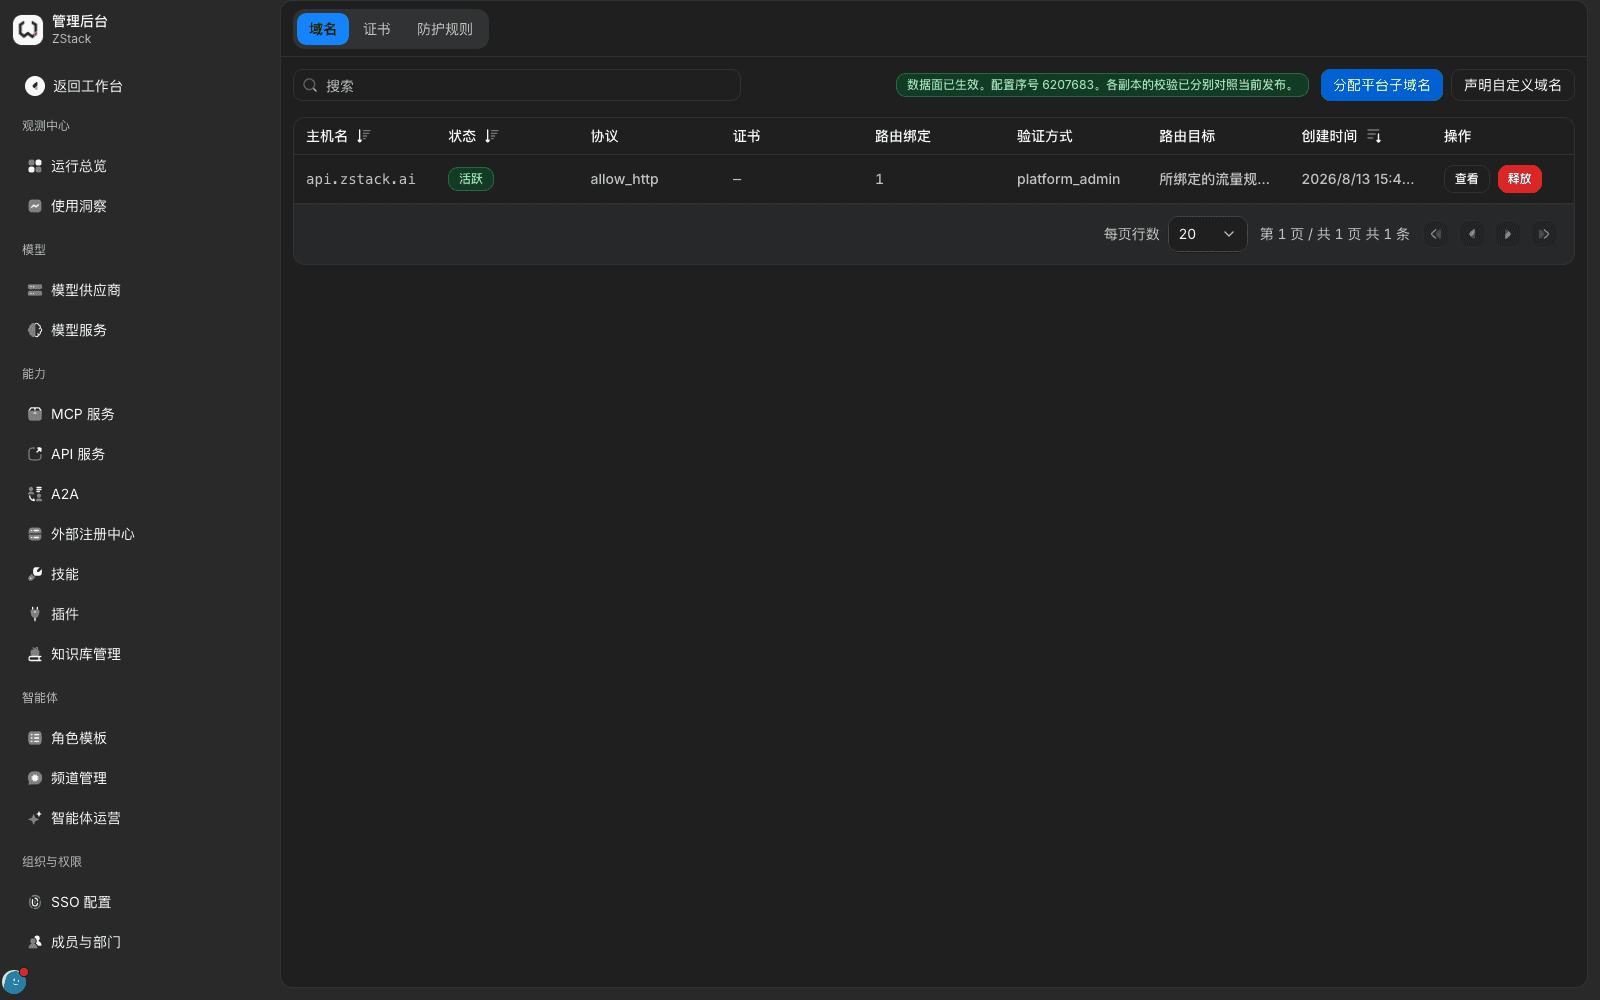
Ingress domain and certificate (tenant side): the gateway-domain page is not in the sidebar. Open any session detail from 「Operations overview › Sessions」 and click 「View access method」 on the gateway hint bar. On the 「Domains」 tab, look at the top prompt. 「Data plane is in effect. Config sequence N. Each replica's check has been compared with the current publish.」 means the change has synced to every replica. The 「Certificates」 tab shows certificates; 「—」 if none is uploaded.
Note
- When a node leaves the ingress pool, is draining, or is offline, the control plane marks the status and alerts, but it does not automatically change DNS, and it does not provide virtual-IP failover. Taking traffic off is done by the load balancer based on
/readyz, or by operations changing DNS. - Drain waits for in-flight streaming responses to finish. On long connections it can take much longer than expected; include that time when you schedule the window.
23.4 Health checks and graceful drain
| Endpoint | Use | Returns |
|---|---|---|
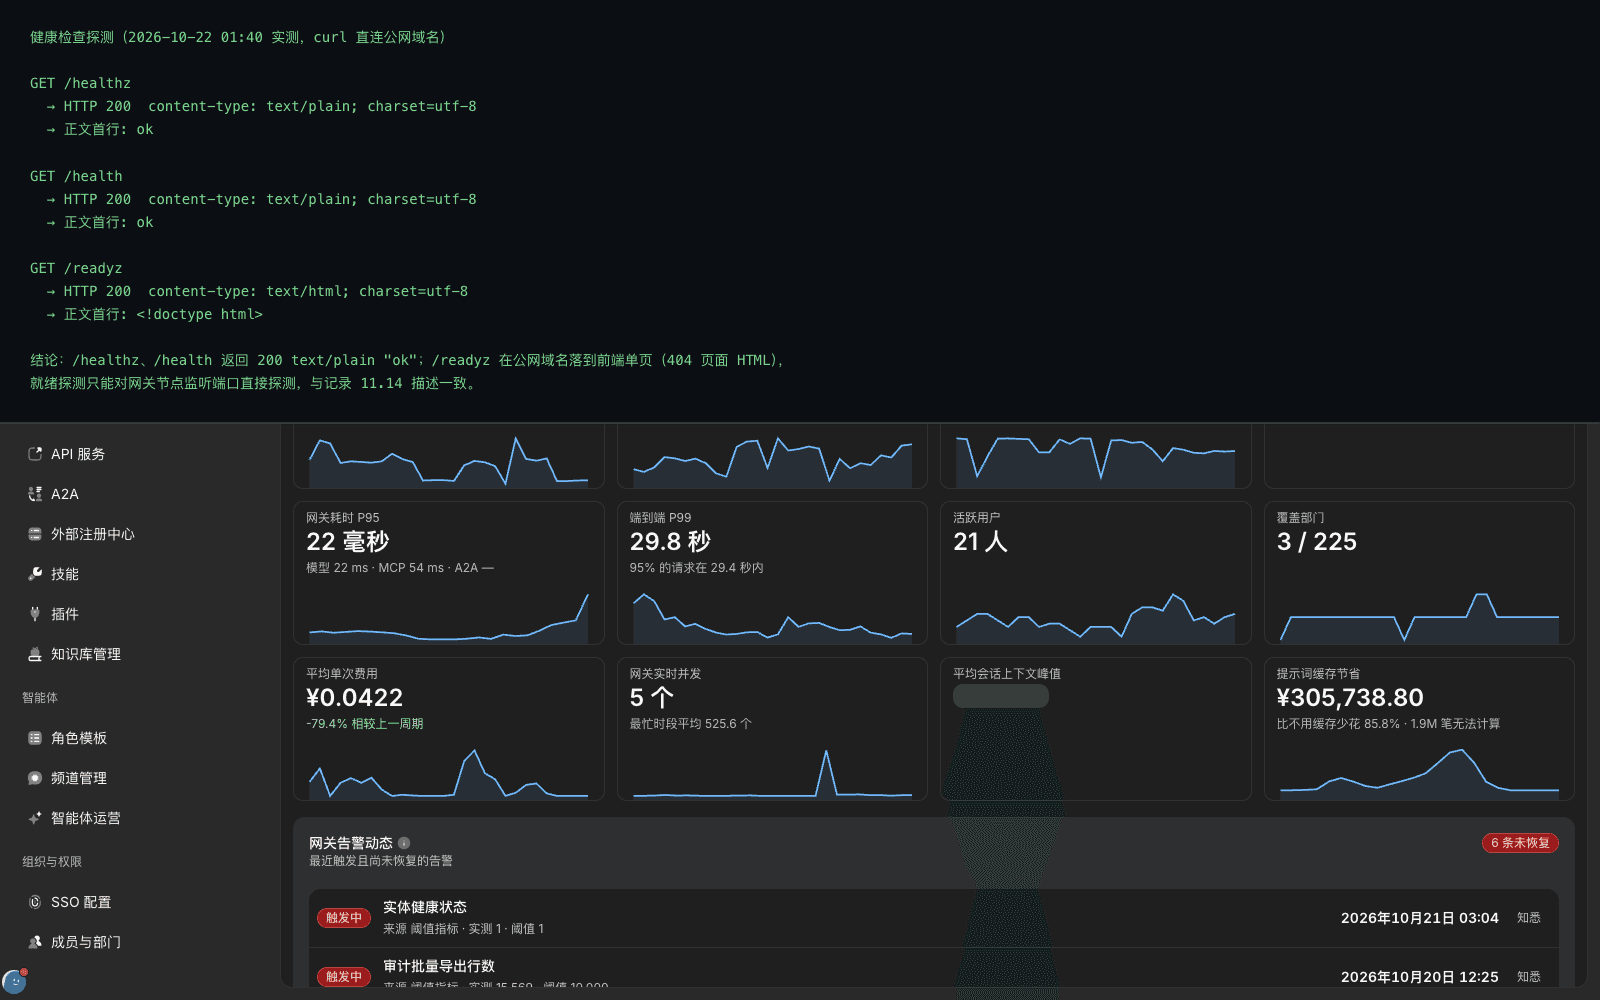
/healthz | Liveness probe | 200 with body ok when the process is alive |
/readyz | Readiness probe | 200 when configuration is loaded; also 200 when disconnected from the control plane but still serving from local configuration (degraded — do not take it out); 503 when there is no configuration; returns draining=true while draining |
Note
/readyzis provided only on the gateway node's listen port. Hitting it through the console domain lands on the console page. The load balancer should probe the node port directly.- Node shutdown has two stages: first take traffic off,
/readyzis not ready, the load balancer stops dispatching; then close ingress. New requests are rejected with503 gateway_draining(hint to retry after 1 second). Exit after streaming responses finish. - For a rolling restart or upgrade, on each node in turn run 「Drain → upgrade or restart → ingress self-check → Join ingress pool」, confirm recovery, then handle the next. Afterwards, check 10 minutes before and after the release in 「Operations overview › Requests」.
23.5 Backup, restore, and upgrade
Neither capability is available on the tenant console. 「Backup & Restore」 and 「System Updates」 are tabs of platform-console 「System maintenance」 (/admin/maintenance), and they depend on the updater component installed at deploy time. In the current deployment shape, visiting them as a tenant administrator sends you back to 「Operations overview」. The backup API returns availability=updater_unavailable, canStartBackup=false, and an empty list; the upgrade API returns updater_unavailable. Whether the capability exists and how to run it follows the actual deployment.
Backup (fixed items to write into the operations handbook): name the objects and owners — platform database, analytics database, object storage, install state (including deploy configuration and the master key). If the first three use an existing customer service, that service's own backup is responsible, and it must be aligned to the same point in time as the platform backup. Name the frequency, retention, and rehearsal cadence (the platform does not provide a tenant-configurable backup plan). At least rehearse in isolation before every major-version upgrade.
Upgrade: confirm the control plane and gateway nodes are the same version and handle both sides together. For a cross-version upgrade, confirm whether an intermediate version must be taken first. Before upgrade, keep a baseline and record the backup identifier, schedule a window, and notify (the console may be briefly unavailable while it is switched; gateway calls are usually not affected, but in-flight long connections may drop when you roll nodes). Roll per node, one at a time (flow in 23.4). After completion, verify recovery on four items: status page green, a minimal request returns 200, an unauthorized key is still rejected, audit records are continuous.
Note
- Restore overwrites local data with the backup. Data written afterwards is lost. You can restore only a backup of the same version and the same deployment shape. Upgrade and restore cannot run in parallel.
- Whether you can roll back after an upgrade depends on whether database changes have landed. The rollback plan follows the actual deployment. A version mismatch between the two sides often shows as a 「configuration behind」 alert that will not clear, or nodes reconnecting repeatedly.
23.6 Emergency disable
When to use this: a leaked key, an abnormal account, an unavailable upstream, or a rule producing wrong blocks, and you need to stop the bleeding immediately.
| Object | Disable entry | Effect | How to restore |
|---|---|---|---|
| API key | Model Groups › API key management 「Disable selected」 | Calls with that key are rejected immediately | Not recoverable; reissue |
| Model group | Detail › Basic information › turn off 「Publish」 | Every call through that group is rejected | Turn 「Publish」 back on |
| Model provider | Turn off 「Enable」 on the detail | Models that reference it are unusable | Turn it back on |
| Traffic rule | Status switch in the rule list | Requests no longer match this rule | Turn the switch on again |
| Member account | Members & Departments › move to departed | Sessions, keys, and tokens fail | Restore employment |
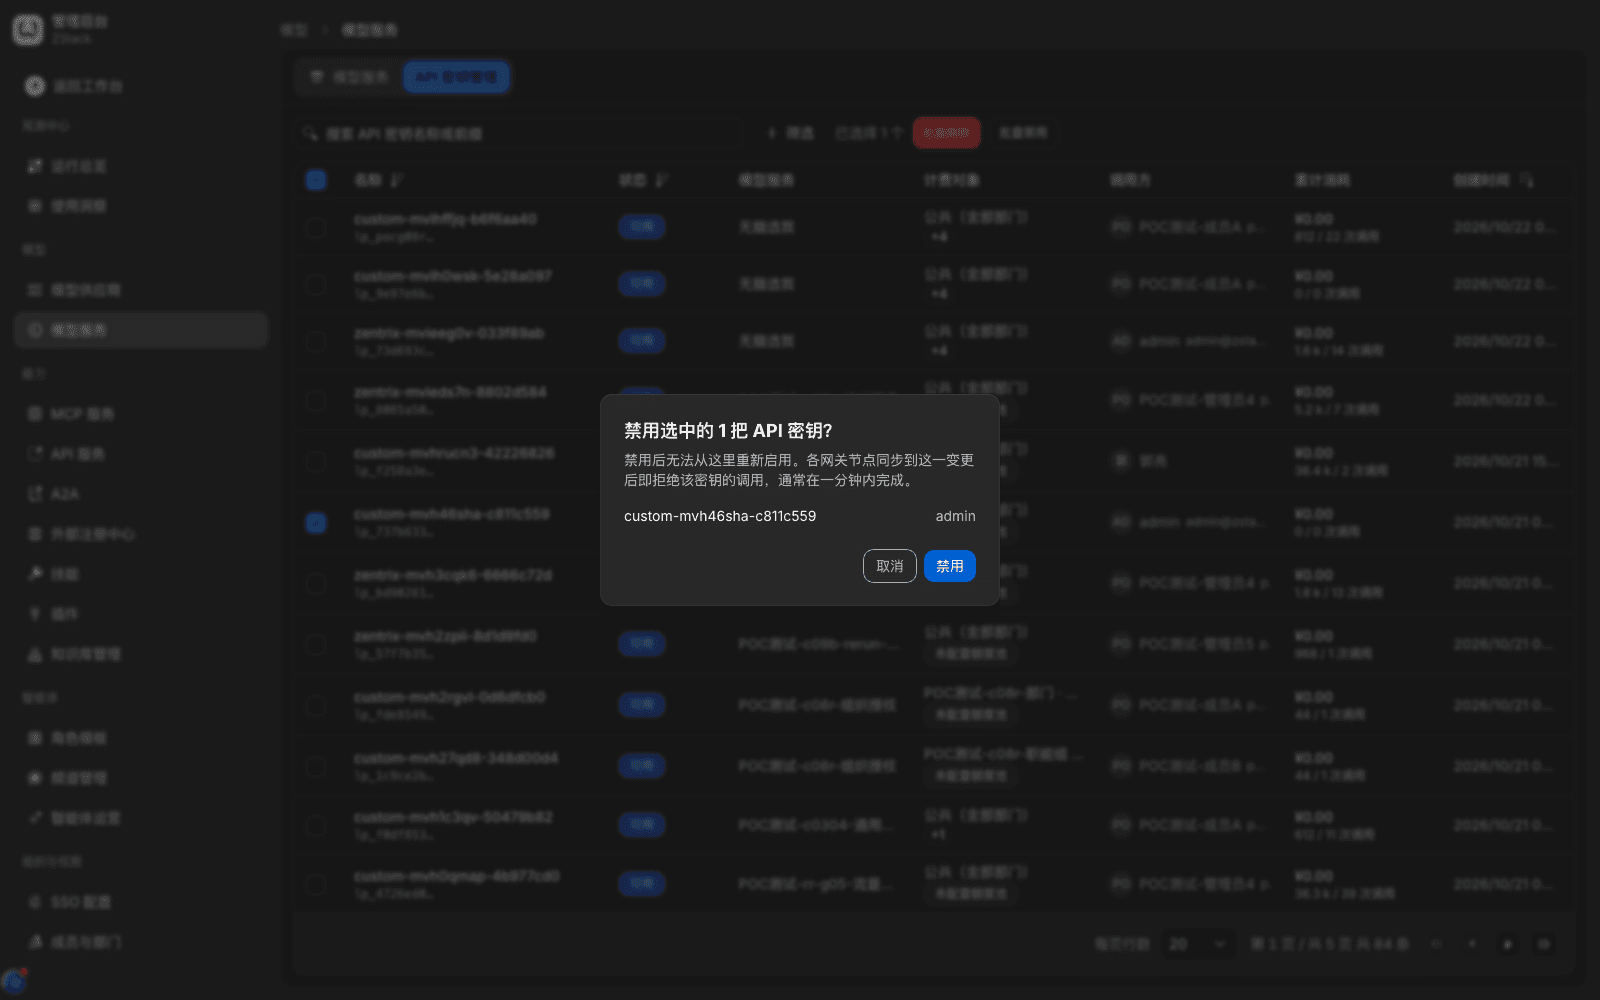
Procedure (disable a leaked key): in 「Model Groups › API key management」, search by key name or prefix, tick, check the 「Selected」 count, click 「Disable selected」. Make one call to confirm it is rejected, then confirm an 「API key · Revoke」 record appears in 「Operation audit」.
What you will see
- After a key is disabled, calls return
403withreasonPERMISSION_DENIED— the meaning is 「this identity is not allowed」, not 「the key does not exist」. Say that clearly when you explain it to the caller. - After you turn off 「Publish」, calls start being rejected in about ten-odd seconds, returning
401withmessageInvalid or expired gateway credentials.The error does not say 「the service is disabled」. Notify callers after you disable. Restoring after you turn 「Publish」 back on is not instant; it takes minutes. Probe continuously with a minimal request during that time; do not toggle the switch repeatedly.
Note
- 「Disable selected」 has no second confirm. It takes effect as soon as you click. Check the tick count before you operate.
- When you need to 「pause without voiding」 a caller, do not disable the key; use a traffic rule 「Reject this call」. After handling, write the reason, scope, and restore time into the operations record.
23.7 Tuning runtime parameters
Parameters are mainly controlled as traffic-rule actions, and they take effect hot. Rate limiting and queuing are in 21.4; timeout and circuit breaking are in 21.3 and 21.5.
Per-request body size limit: open 「Traffic rules › New rule」, narrow conditions to the target caller (for example 「Caller = a given API key」 and 「Call type = model call」), add the action 「Per-request body size limit」, fill the limit (KB), and save.
What you will see: requests over the limit return 413; those under it return 200. A clearly unreasonable value turns the field red, greys out 「Save rule」, and shows an internal error identifier under the field rather than a business hint; correct it to the allowed range. 「Review this change」 lists hit order, but that position is shown as 「rank N · unnamed rule」.
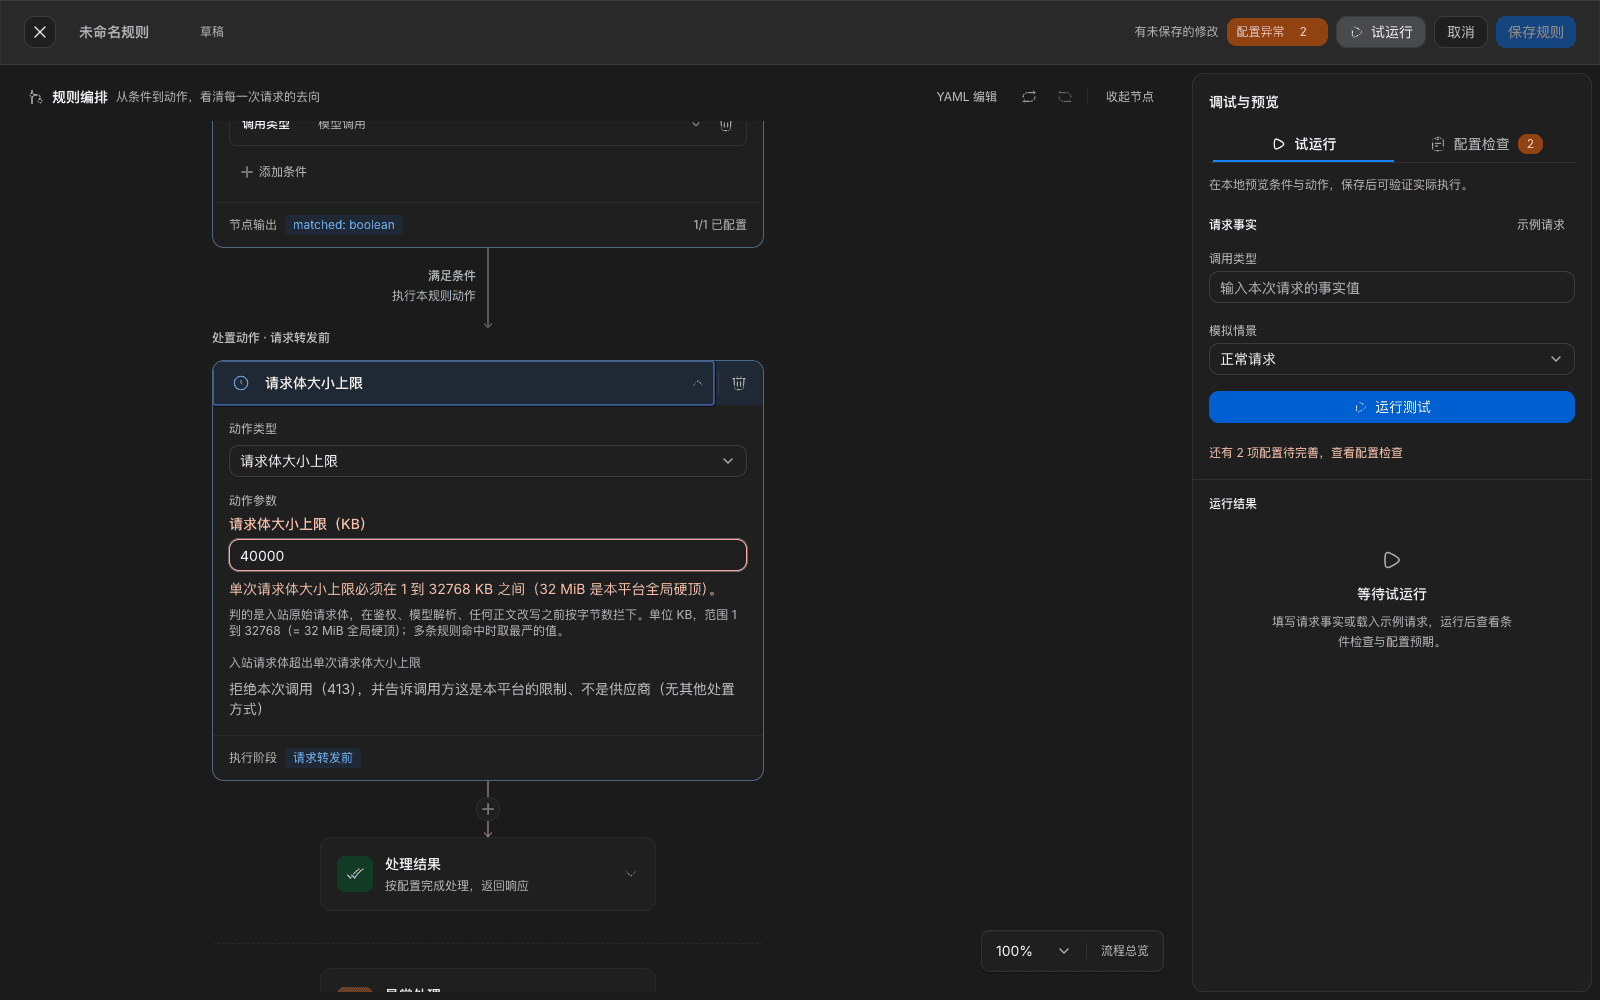
Note: cap-class parameters take effect per caller. Validate first with a rule that matches only a test caller, then widen.
23.8 Multi-node high availability
| Layer | Designed behavior |
|---|---|
| Control plane | Can have several replicas. The primary keeps identity with a 45-second lease; takeover after it expires. The console is unavailable during that time; calls are not affected |
| Gateway nodes | Configuration and snapshots land on disk. On restart they load local configuration first, then connect to the control plane. Normal for 2 minutes of disconnect; after timeout judged offline and alerted; the node keeps serving |
| During disconnect | Request records write to local staging and are shipped after recovery. When staging is full, follow the node setting 「reject new requests」 or 「drop the body and keep only metering」 |
| Database | Can use the customer's existing HA cluster or HA data layer. When the primary fails, the data plane keeps forwarding; console writes fail |
| Ingress | Load balancer in front of several nodes. A single-node fault is taken out by the health check and rejoins the ingress pool after recovery |
| Dual site | Data plane active-active, data layer single-writer with physical replication. A whole-site fault must isolate the failed site first, then implementation staff promote the standby under control |
All of the above need a platform administrator or the deployer. Rehearsal suggestions (complete in an isolated environment before go-live; record cutover time and failed-request count): ① while calls continue, stop one gateway node; watch take-out time, failed-request count, and that the node is judged offline and alerted within 120 seconds; ② stop the primary control plane; confirm primary identity moves in about 45 seconds and calls are not affected; ③ stop the control plane, platform database, and analytics database in turn; confirm calls keep succeeding and /readyz stays 200.
Note
- The product does not provide gateway grouping: every node receives the same whole-platform configuration and shares one ingress pool. Use region tags, per-node egress policy, and the customer's DNS / load balancer to schedule nearest-region access.
- Do not treat
/readyzdegraded as a fault: a node disconnected from the control plane but still serving from local configuration returns 200. Taking it out then loses capacity.
23.9 Egress and network scope
- Egress proxy is configured per gateway node: a platform administrator adds a proxy in 「Egress proxies」 on the 「Gateway › Egress & proxies」 tab, then configures rules and the default egress for each node in 「Egress policy」 on the node detail. Save distributes it.
- Egress verdicts: 「Egress verdicts」 on the 「Gateway › Egress & proxies」 tab summarize, from the last 5 minutes of real calls and node probes, each node's status to each egress destination. When one node is clearly worse than others to a destination (high connect-failure rate, slow first byte, upstream rejecting by region), it is judged 「Avoid」, and that node no longer prefers that destination.
- Egress connectivity: 「Runtime monitoring › Egress connectivity」 shows packet loss and latency from each node to probe targets under 「Overview」, 「Probe targets」, 「Diagnosis history」, and can start a hop-by-hop diagnosis to any target. The on-page 「Enable egress probing」 switch controls periodic probing.
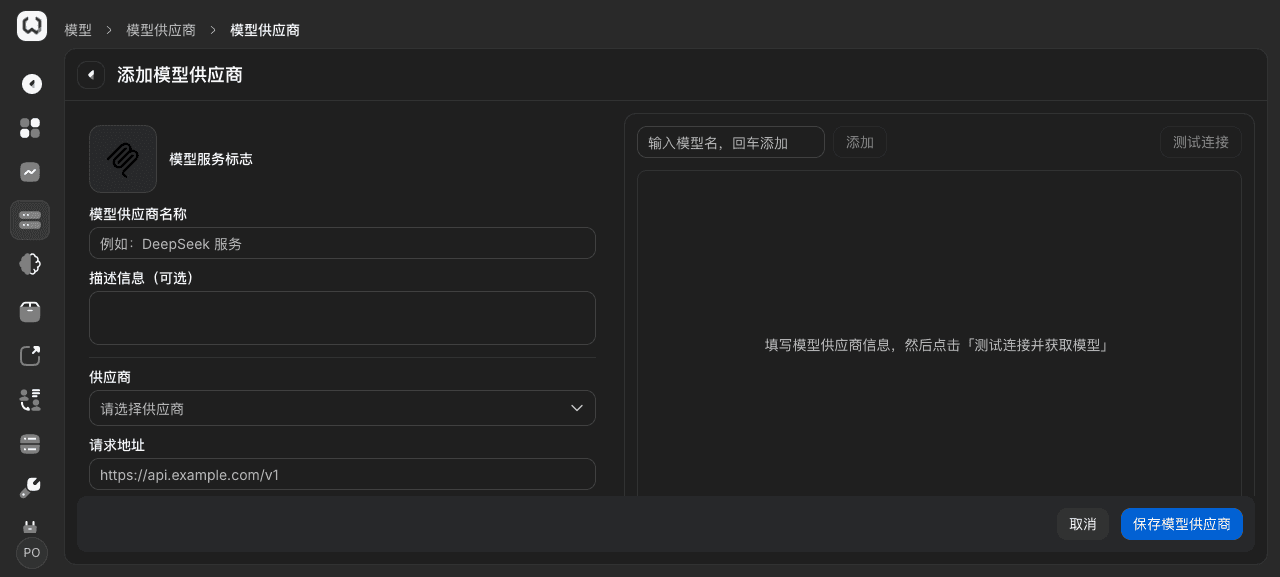
- 「Network scope」 on the model-provider form (Unclassified / Intranet / Public) is only a label. It does not decide the egress method, and there is no provider-level proxy-address field.
Note: proxy connect failure, target connect failure, and blocked by outbound protection each have their own error kind in the request detail. When a test fails, have an administrator check the proxy address, port, and authentication.
Capability notes
| Capability not provided | What to do instead |
|---|---|
| Tenant-console entries for backup/restore and system updates, and the real build version | All implemented on the platform side according to the actual deployment. The operations handbook names backup objects, frequency, retention, and rehearsal cadence; version follows the release note (see 23.5) |
| Gateway grouping, automatic DNS changes, built-in virtual-IP failover | Every node shares the ingress pool. Schedule with region tags and per-node egress policy; the customer load balancer takes traffic off based on /readyz (see 23.4, 23.8) |
| View and restart gateway nodes on the tenant console, and capacity-planning tools | Node operations are done by a platform administrator. When the console is unavailable, run zenova status on the host. Capacity is estimated by implementation from traffic |
| Tenant-side host-capacity alerts | Tenant alert-rule metrics do not include host capacity; platform-side operations alerts own that (see Chapter 22) |
| Unified RTO / RPO commitment | Follow the rehearsal result in the customer environment and the implementation plan (see 23.8) |
| Configure egress proxy per provider or tenant | Configure egress policy per node (see 23.9) |
Previous: 22. Alerts, notifications, retention, export, and operation audit · Next: 24. Maintaining and changing common configuration
22. Alerts, notifications, retention, export, and operation audit
Full-length chapter. Content is checked against the 2026.10 mainline code and the live console; menus and features depend on the current license, account permissions, and delivered environment.
24. Maintaining and changing common configuration
Full-length chapter. Content is checked against the 2026.10 mainline code and the live console; menus and features depend on the current license, account permissions, and delivered environment.