20. Gateway requests, sessions, and root-cause location
Full-length chapter. Content is checked against the 2026.10 mainline code and the live console; menus and features depend on the current license, account permissions, and delivered environment.
Back to overview · Full table of contents · Download full PDF
This chapter: for platform administrators, operations staff, and security auditors. How to search a single gateway request, read the five tabs of a request detail, tell which client a call came from, reconstruct a multi-turn conversation by session, look at MCP tool-call activity and policy hits, and the handling path when traffic spikes or a circuit breaker opens. Entries and visible roles are in section 19.1. Symptom-based investigation is in Chapter 21.
20.1 Search gateway requests
The 「Requests」 tab records every model, MCP, A2A, and API-service call that went through the gateway, including requests blocked by policy. Investigating any runtime issue starts with finding the target request here.
Prerequisites: the account is a tenant administrator, or has an operations, finance, or audit role. An operations role sees only requests they started.
Procedure
- Open 「Admin Console › Observability › Operations overview」, choose the 「Requests」 tab, and in the toolbar pick a time range that covers when the issue happened. The 「Request trend」 bar at the top of the page can be dragged to narrow the window further.
- If you know the request ID, Trace ID, or member, type it in the search box. The request ID is from the
x-request-id(orx-lp-data-plane-request-id) response header; the Trace ID is fromx-trace-id. - To filter by condition, click 「Filter」 and add conditions. Conditions show as 「field = value」 in the toolbar. Click 「×」 to remove one, 「Clear」 to remove all.
- Click a target row to open the request detail (section 20.2). The top left of the detail can switch previous / next in the current list.
- Common filter combinations can be saved through 「Views」. To export the current result, click 「Export CSV」.
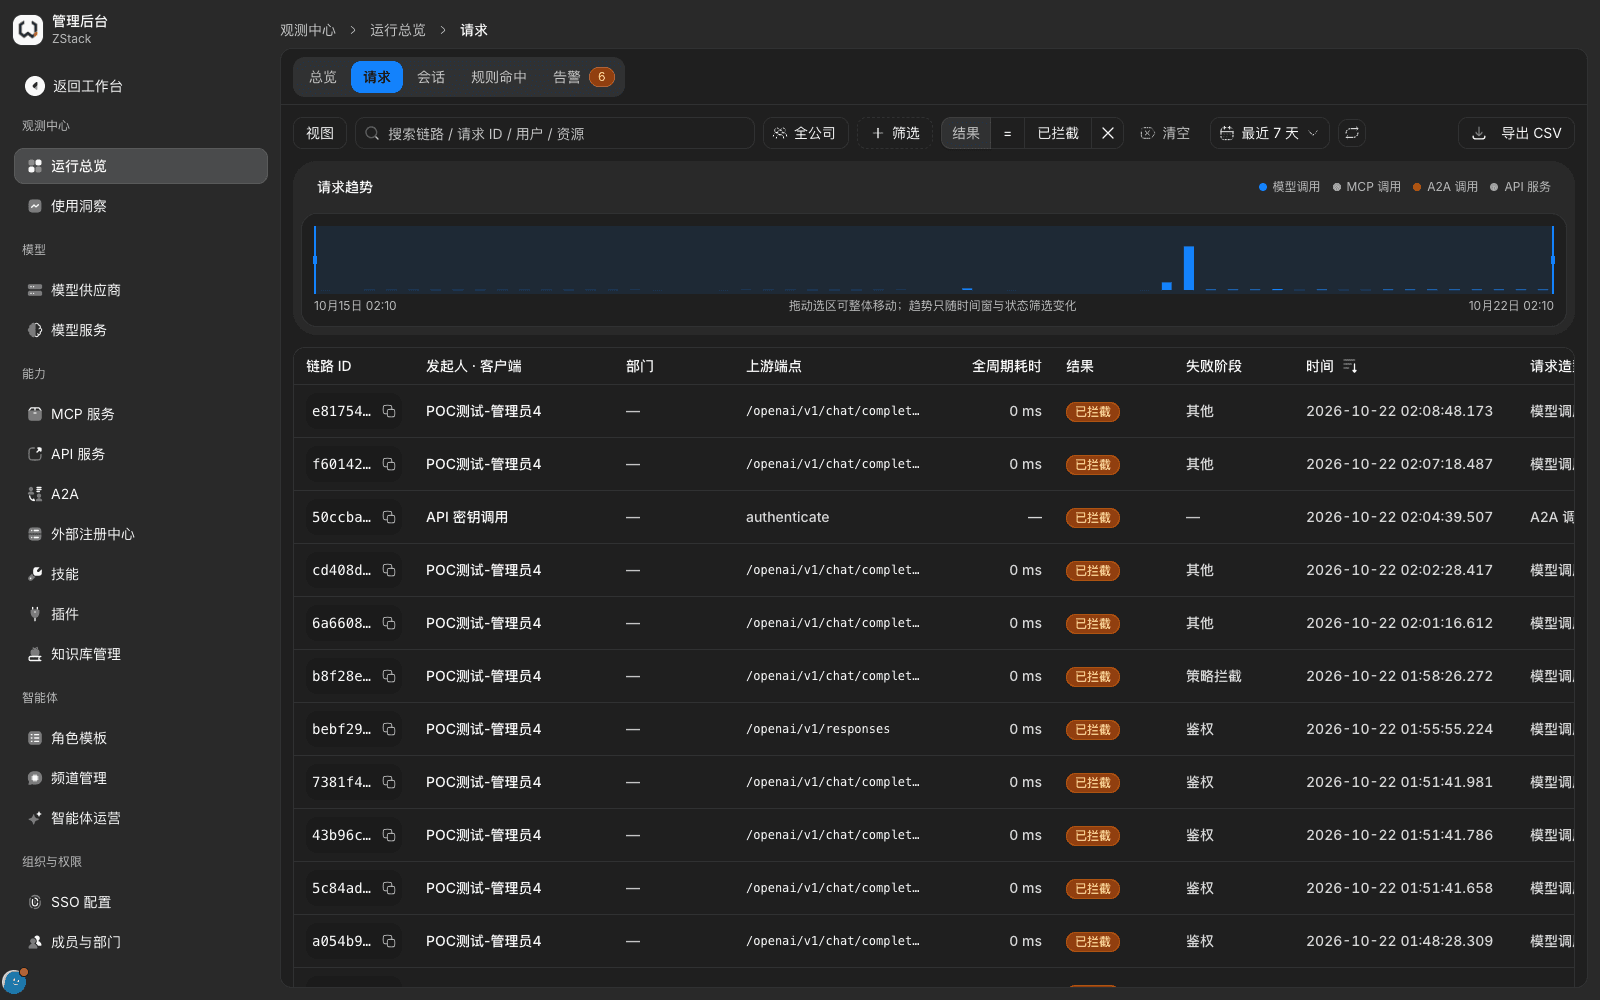
Common conditions include: result (Completed / Failed / Cancelled / Blocked), HTTP status code, latency range, actor, access credential, client, end user, model, provider, channel, call type, MCP tool, matched policy, responsible party, this attempt failed, how the gateway caught it, purpose, reasoning intensity, tag, session ID, request ID. 「How the gateway caught it」 takes Retry, Failover, Queue. Main list columns include Trace ID, Caller · Client, department, upstream endpoint, full-cycle latency, result, failure stage, time, request shape, latency breakdown, gateway latency, upstream-response latency, model, purpose, reasoning intensity, usage and cost.
Note
- 「Export CSV」 has fixed fields. It exports the current filter result. There is no field picker or format customization. When the list is large, narrow the time range first or search exactly by request ID.
- Requests that failed authentication because of a wrong or forged key cannot determine caller identity, and do not appear when you filter by access credential or actor. Investigate by searching the
x-request-idthe caller received, by request ID.
20.2 Read a request detail
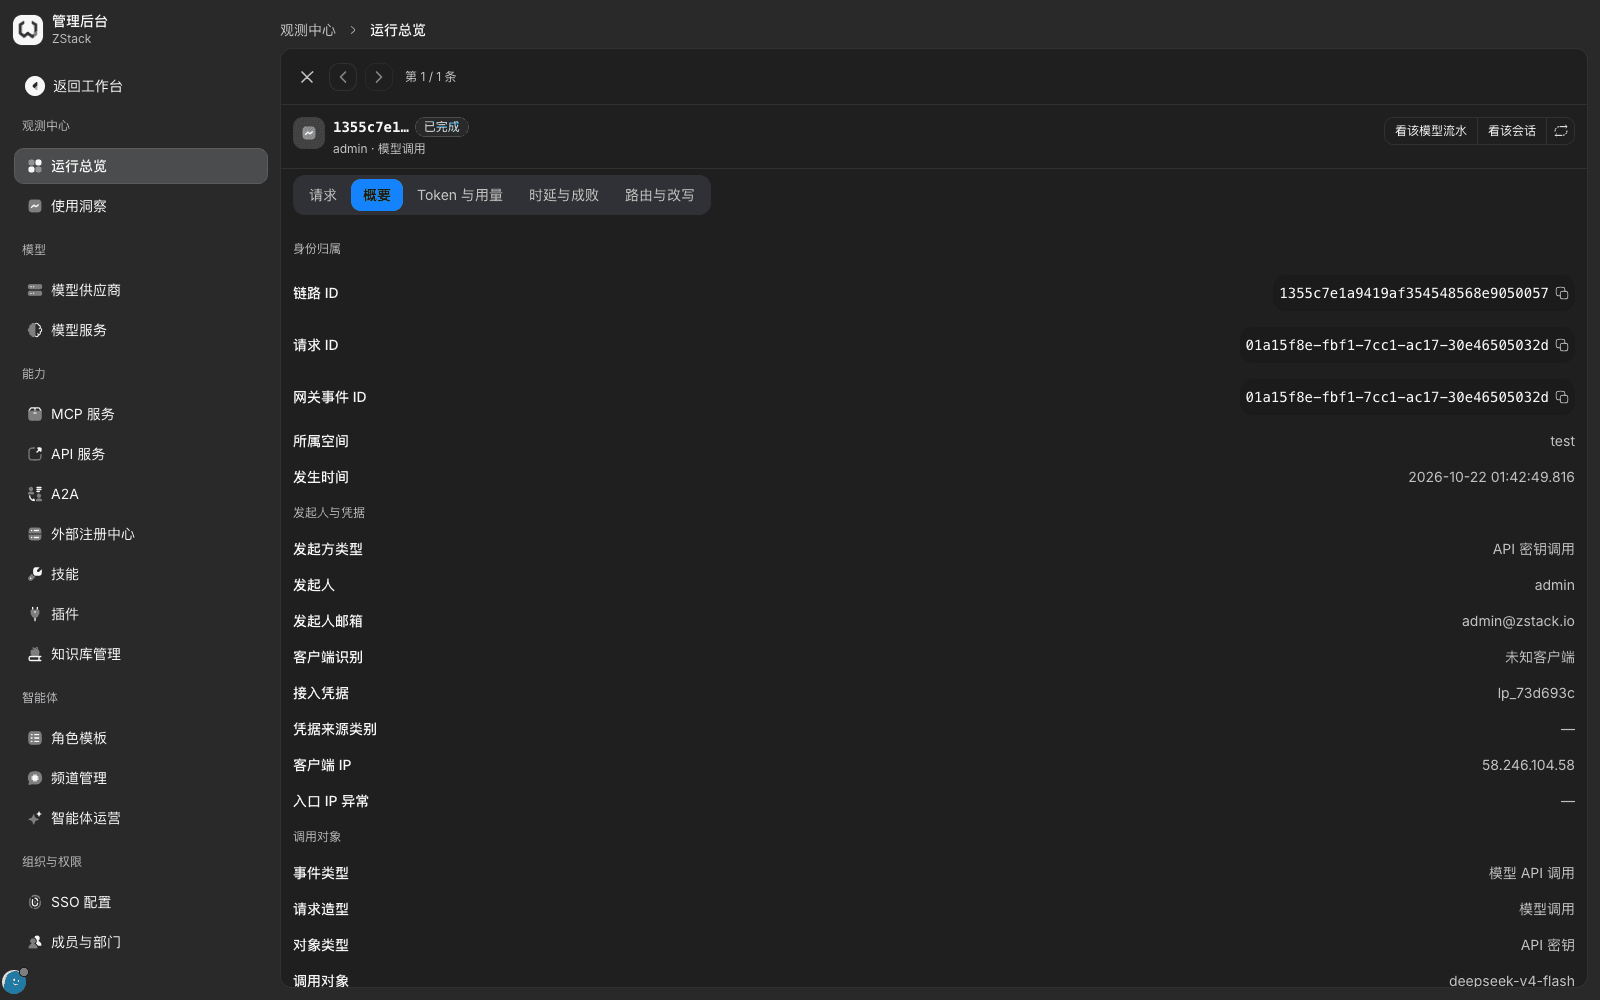
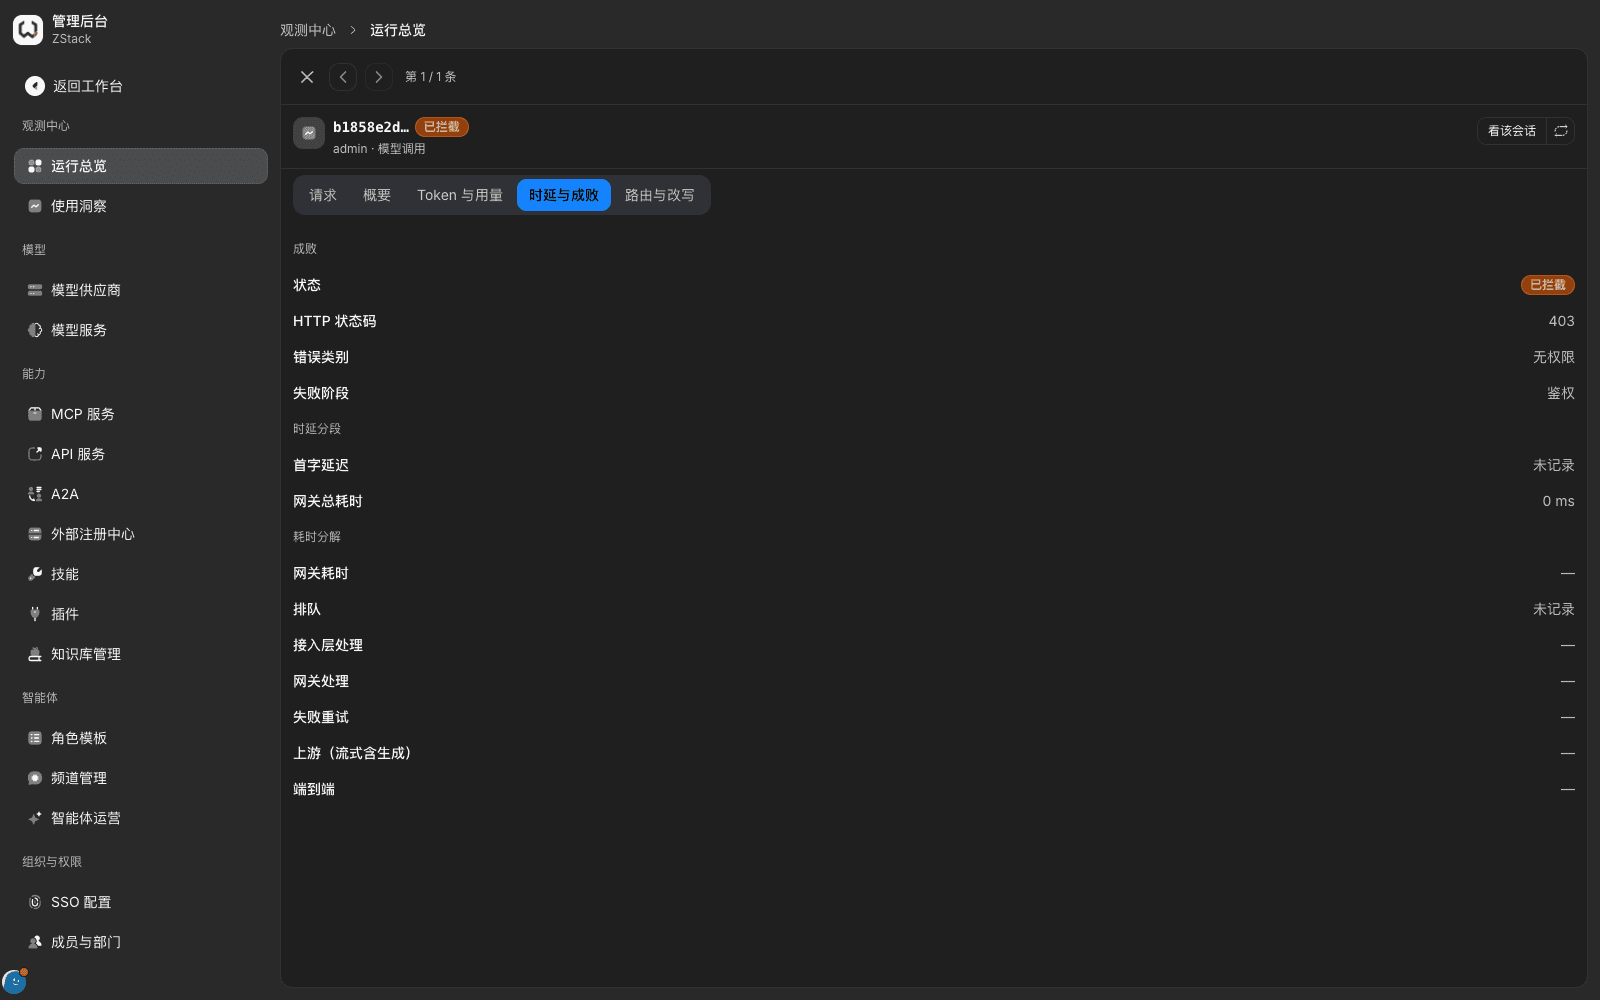
The detail header shows Trace ID, result, actor, and request shape. The top right provides 「View this model's traffic」, 「View this session」 (shown for requests that belong to a session), and refresh. The five tabs answer: Request (four payload legs), Summary (who started it with which credential from which client, and which model and service were finally used), Tokens & usage (usage and cost), Latency & outcome (success/failure and latency distribution), Routing & changes (where it went, how many tries, what was changed, which rules matched).
「Summary」 has four groups: identity (Trace ID, request ID, gateway event ID, workspace, occurred at, retention), actor and credential (initiator type, actor, actor email, client identification, access-credential prefix, client IP, unusual ingress IP), call object and model resolution (event type, request shape, object type, client-declared model, actual routed model, metering group), tags.
Four payload legs and the diff
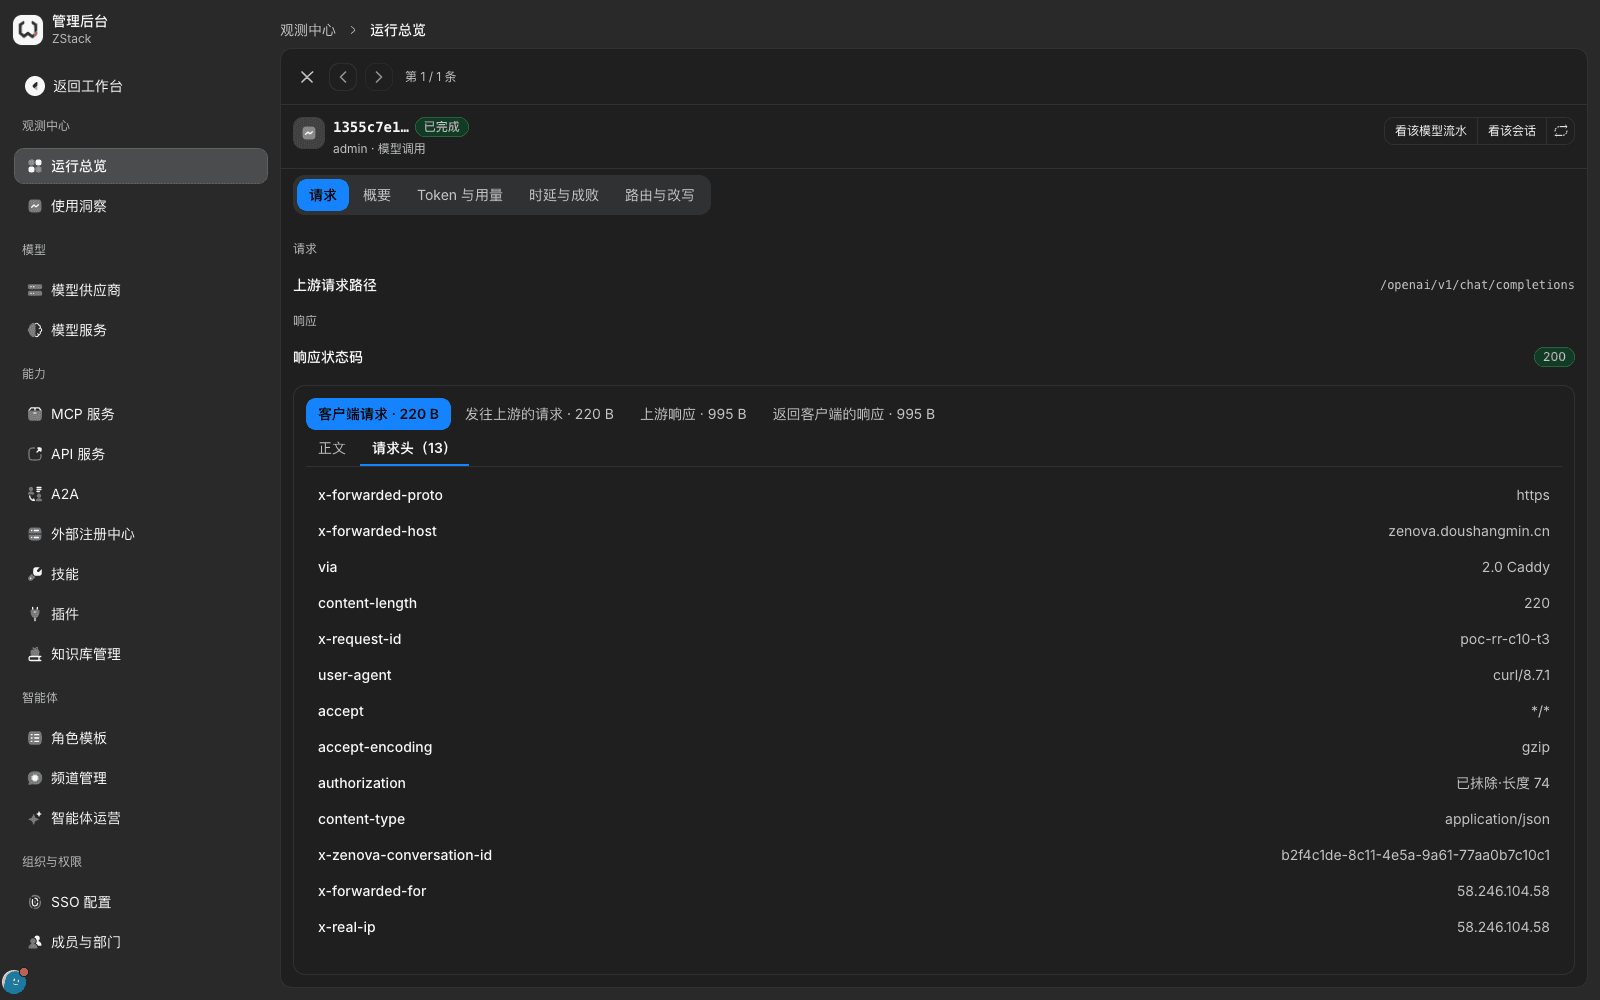
- In the payload area, choose a leg: 「Client request」, 「Request to upstream」, 「Upstream response」, 「Response to client」. Each leg shows byte count. When retry or failover happened, upstream legs are split by attempt order.
- Under each leg, switch 「Body」, 「Request headers」 (or 「Response headers」). 「Copy all」 copies the current leg.
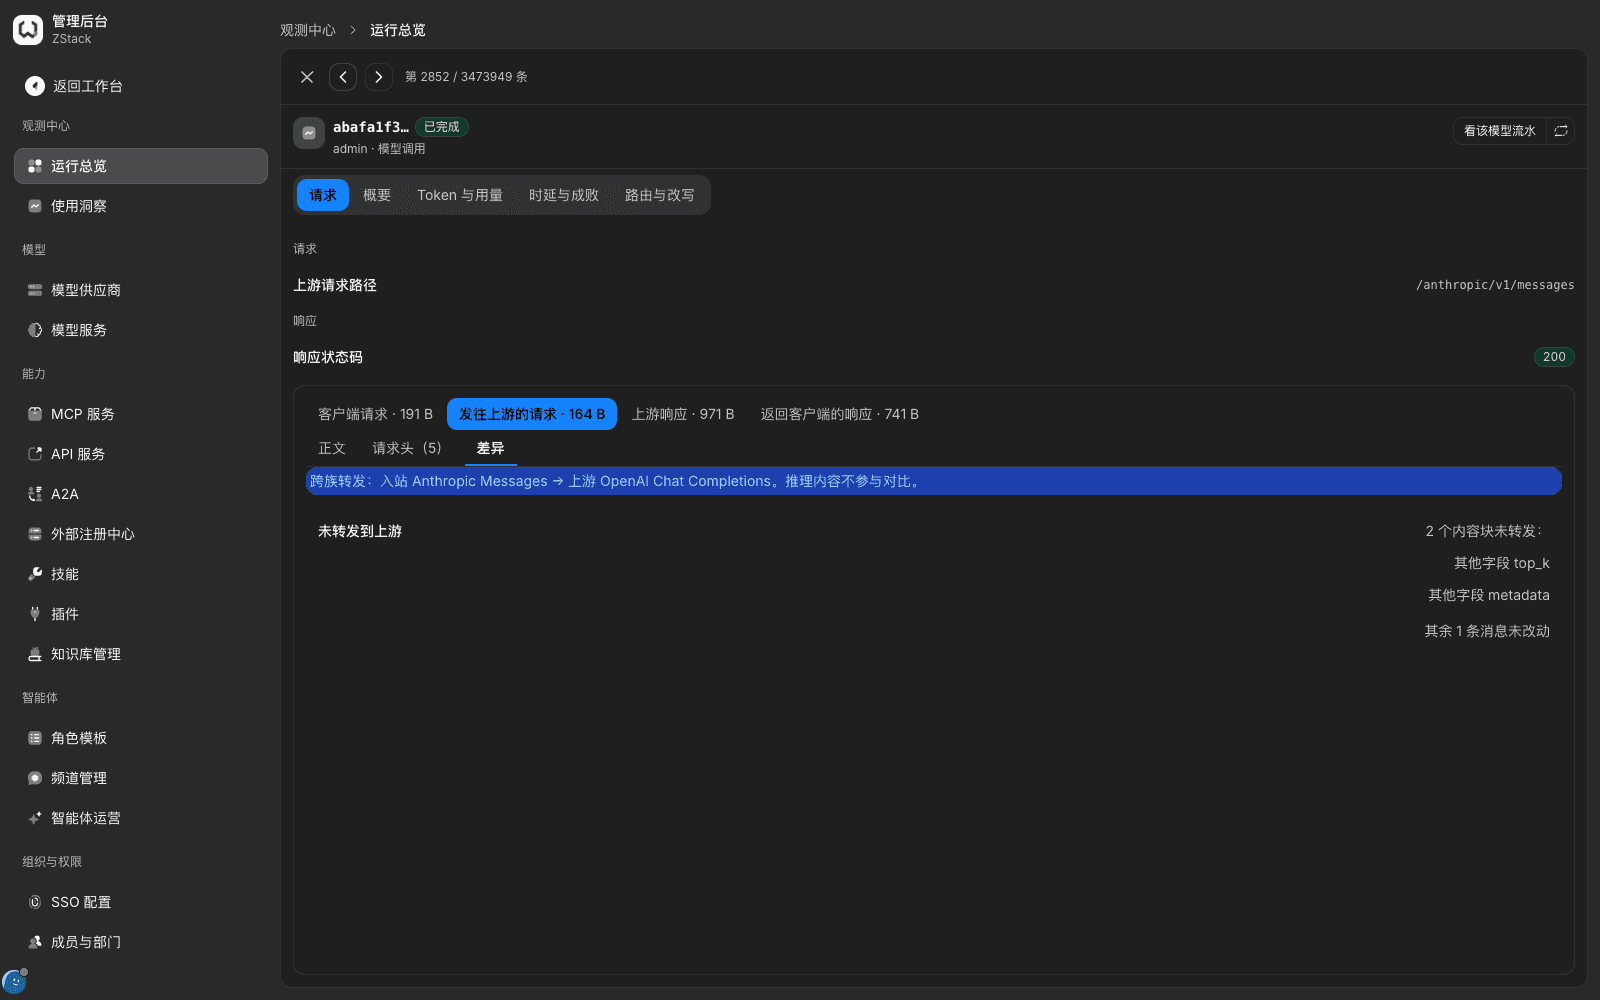
- Under 「Request to upstream」, choose 「Diff」 to see what the gateway changed relative to the client request. On a cross-protocol forward, the page top notes inbound and upstream protocols, for example 「Cross-family forward: inbound Anthropic Messages → upstream OpenAI Chat Completions」. Fields that were not forwarded upstream are listed item by item in 「Not forwarded upstream」.
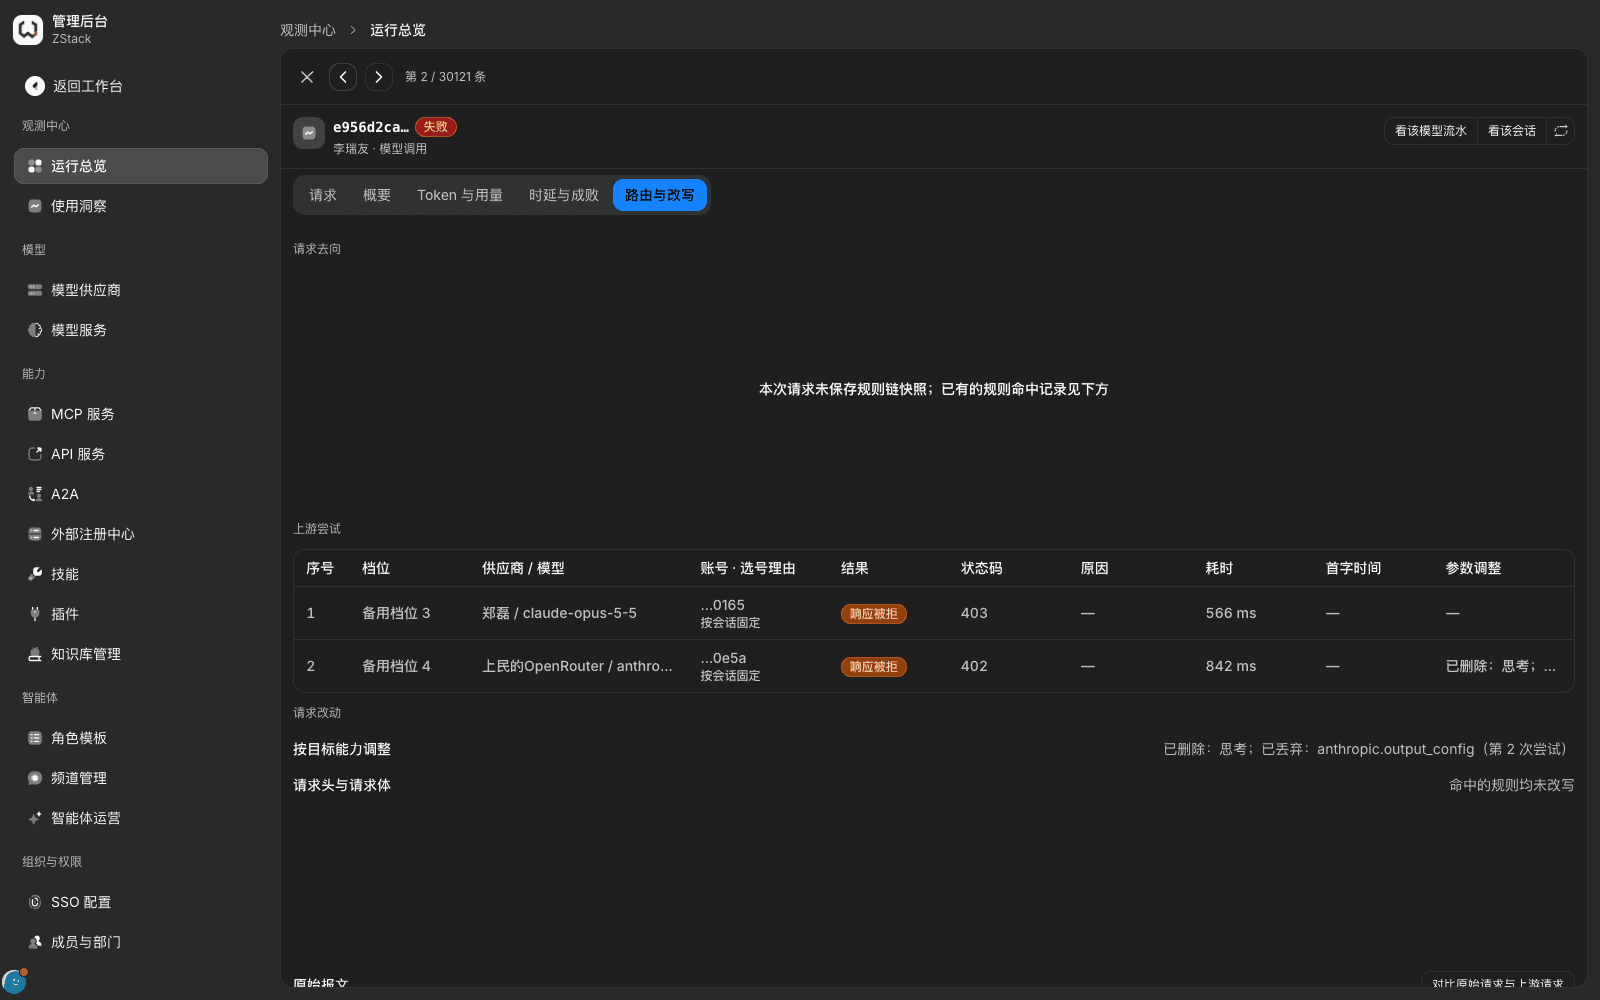
Latency and routing: 「Latency & outcome」 gives status, HTTP status code, failure stage, error kind, and block reason, and shows the latency breakdown as a Gantt bar (definitions in section 19.2). Latency fields on a blocked request are empty. 「Where the request went」 on 「Routing & changes」 gives the declared model, the taking-over rule, the final provider and model, and the routing conclusion. 「Upstream attempts」 gives sequence, tier, provider / model, account and why that account was chosen, result, reason, status code, latency, time to first token, and parameter adjustments, row by row. 「What changed」 lists adjustments for the target capability and rule rewrites. 「Hit records」 gives every policy this call matched, plus their actions and failover.
Note
- Credentials such as
authorizationin request headers are stripped at capture and shown as 「Redacted · length N」. Every read of a body or a diff is written to the audit log. - When a payload is unreadable, the page gives the reason, for example the payload was not retained under data-retention settings, the payload exceeded retention and was cleaned, or the payload is being archived and can be viewed later (section 19.5).
- A policy-blocked request has no upstream leg. The diff view is provided only on the request direction.
- The 「Where the request went」 area may prompt 「This request did not save a rule-chain snapshot」. In that case, use 「Hit records」. When a rule has been deleted, it is marked and the historical hit is kept.
20.3 Tell failure types apart
The same 「call failed」 may be the upstream, a policy, a quota, or the caller. Separate them by these clues:
| Type | Result | Clues in the detail | Returned to the caller |
|---|---|---|---|
| Upstream failure | Failed | 「Upstream attempts」 result is response rejected, timeout, stream interrupted, and similar, with an upstream status code | 4xx / 5xx |
| Policy reject | Blocked | No upstream attempt; action in 「Hit records」 is reject; the rule name is clickable | 403, deniedBy: routePolicy |
| Guardrail block | Blocked | 「Block reason」 has a value; 「Hit records」 has a content-guardrail hit | 403, code: content_policy_violation |
| Quota or rate limit | Blocked | No upstream attempt; 「Error kind」 states the reason and recovery time in Chinese | 429, reason is POOL_EXHAUSTED, TRAFFIC_RATE_LIMITED, and similar |
| Caller request error | Failed | Failure stage is parameter validation, or the upstream returned 4xx | 400 / 404 / 422 |
View failover and the switch cost: in 「Filter」, add 「How the gateway caught it = Failover」 to list related requests. Open one, and in 「Upstream attempts」 look at each attempt's tier, result, and latency. The sum of the two latencies is the total time the user felt. The first attempt's latency is the switch cost. When the cost is too large, adjust that tier's timeout on the corresponding traffic rule (Chapter 15).
20.4 Tell which client a call came from
The gateway automatically identifies common agent clients from features such as the User-Agent request header, for example Claude Code, Codex, WorkBuddy. Unrecognized ones show as 「Custom client」 or 「Unknown client」. The identification is shown in the 「Caller · Client」 column of the 「Requests」 list, request-detail 「Summary › Client identification」, the session list and detail, and the 「Call source」 column of an MCP service (section 20.6).
Note
- When a caller-built program has no recognizable feature, you can create and name a client when you 「Get API key」. Requests are attributed to that client.
- Client identification is for statistics and investigation, not an access-control basis. To restrict access by client, use traffic-rule conditions (Chapter 15).
- Client identification for model calls and source identification for MCP calls are two judgements. Look at both when you judge the real source.
20.5 View sessions and conversation records
Multi-turn calls are chained by session. When the caller sends x-zenova-conversation-id: <会话标识> in a request header, calls with the same identifier go into the same session. When it is not sent, the gateway automatically merges by the client's own session ID, Responses continuation, and continuation of the full conversation history, in that order. The first user message is not used to identify a session (identification order is in section 15.5). Steps the client reports over OTLP are merged into the corresponding session (section 19.3).
Procedure
- On 「Operations overview」, choose the 「Sessions」 tab. The list shows title (taken from the first user message), client, access, member, source, turns, cost, last activity. You can filter by client, source, diagnostic-issue category. You can also click 「View this session」 on a request detail to enter directly.
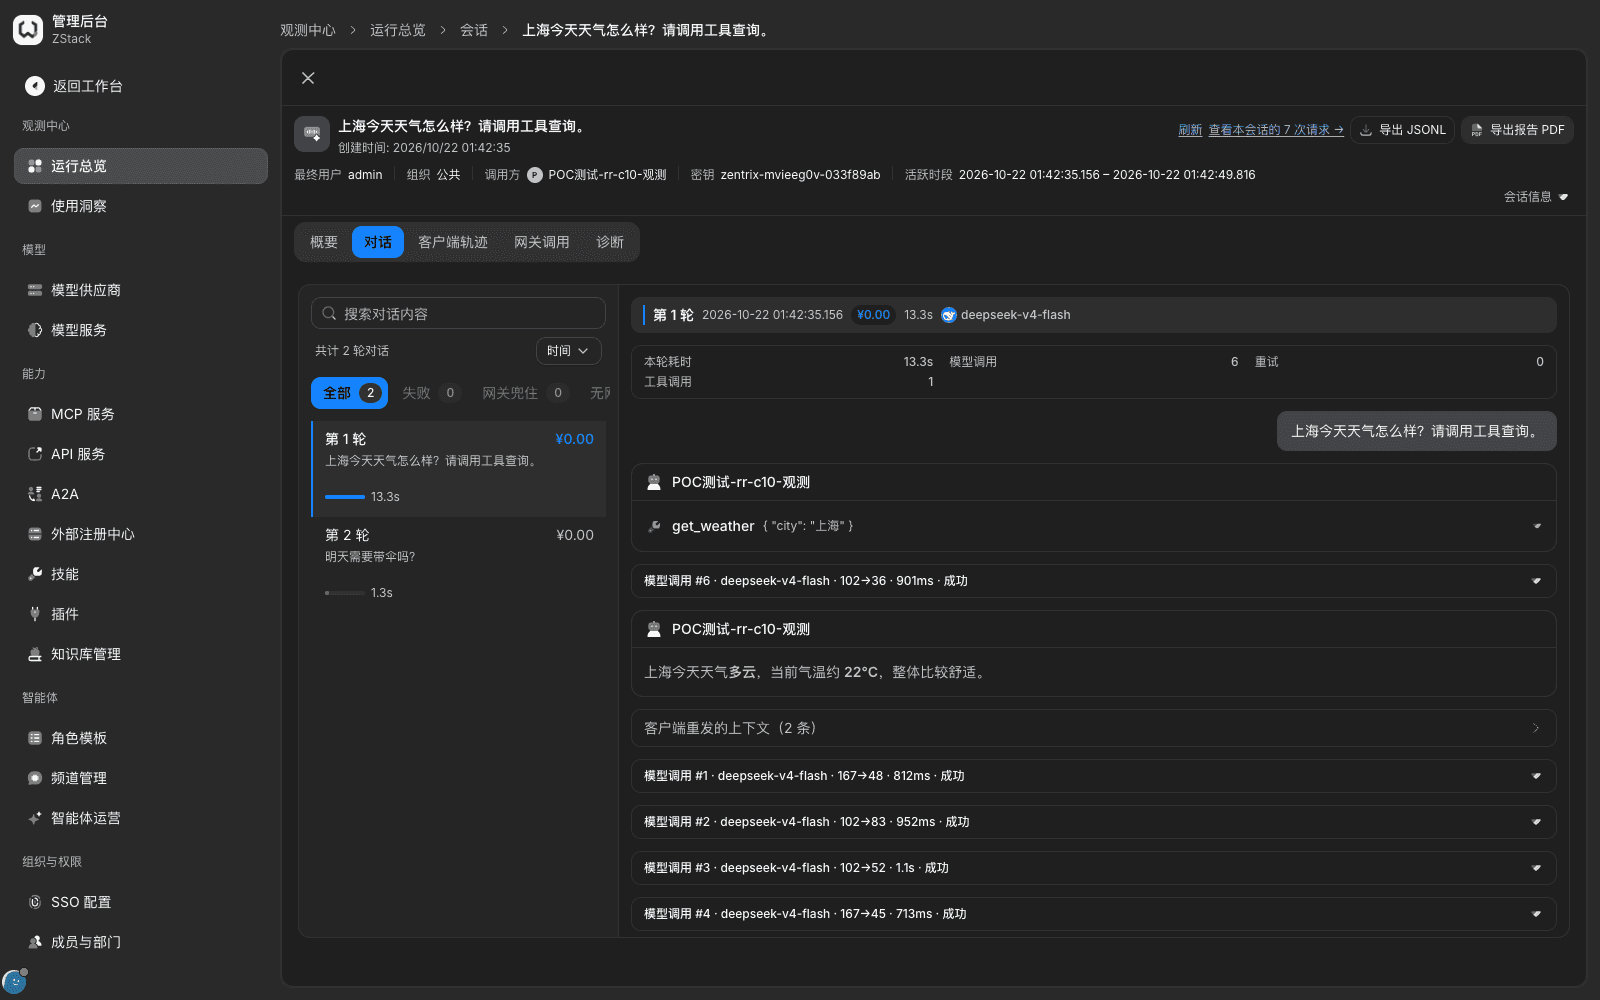
- Open the session detail. The header shows end user, organization, caller, key, and active interval. The top right provides 「View this session's N requests」, 「Export JSONL」, 「Export PDF report」.
- Switch to the 「Conversation」 tab: the left lists first sentence, cost, and latency per turn. You can filter by 「All / Failed / Caught by gateway / No gateway record」 and search conversation content. The right shows the selected turn's user input, model reply, plus that turn's latency, model-call count, retries, tool calls, and each model call's model, tokens, latency, and result.
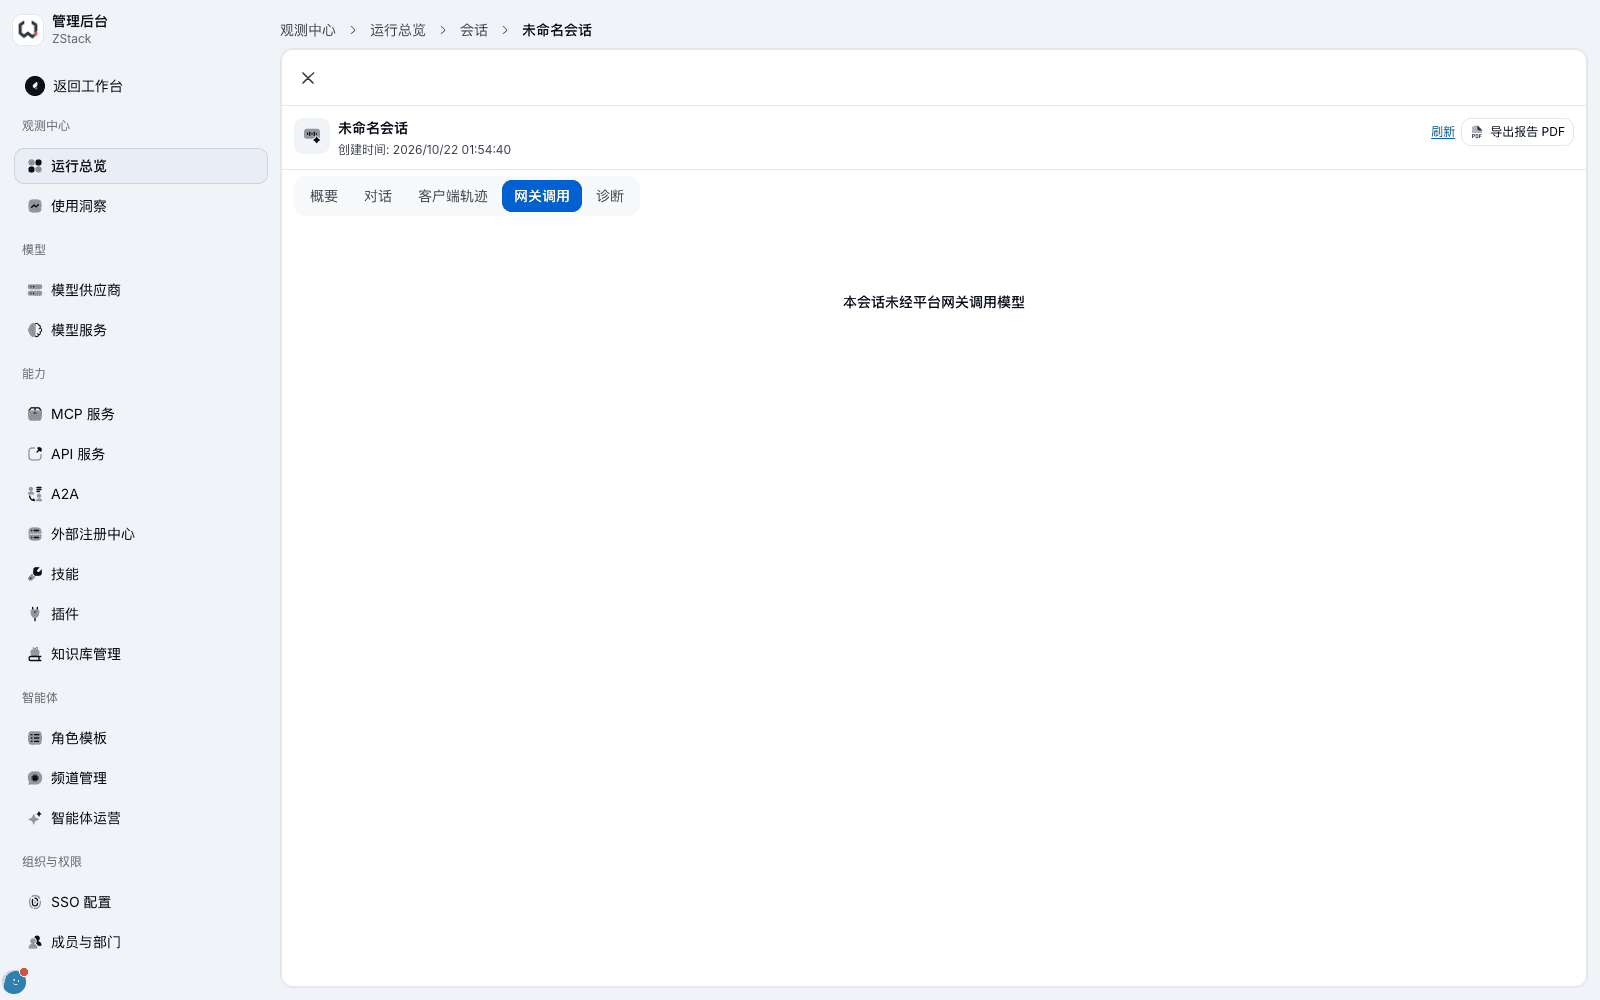
Other tabs: 「Summary」 gives turns (succeeded / failed / in progress), slowest turn, spend, and gateway-call counts. 「Client trajectory」 groups client-reported steps as 「turn › step › record」 with a timeline, and can play them back. 「Gateway calls」 gives a top conclusion, service and channel stats, latency breakdown, and a request timeline expanded as 「turn › call」; each call can open the request detail. 「Diagnosis」 lists diagnostic issues this session matched.
Export a session: 「Export JSONL」 provides 「Hermes training format」 and 「Turn operations detail」. The latter is one turn per line, including session and turn identifiers, start and end time, latency, retry count, model-call count, sub-agent / auxiliary / compression lane counts, and the turn's full messages. 「Export PDF report」 generates a report with session overview, tokens and success rate, per-turn summary, gateway-call conclusion, failure details, policy hits, diagnosis, and audit events, for offline archive.
Note
- When the caller resends a request with the same
x-request-id, both calls are kept. The platform attributes the resend to 「Client-resent context」 and does not count it in 「Retries」. A turn's 「Retries」 counts retries the gateway started internally. - The session list has no keyword search box when the data is large. To locate a session by title, entering from the request-detail 「View this session」 is faster.
- When the 「Gateway calls」 tab shows 「This session did not call a model through the platform gateway」, the client may have connected to the upstream directly. Cost, failures, and policy for that part are not visible on the gateway side.
- Export entries are shown by session source. A client-reported session may only provide 「Export PDF report」.
20.6 View MCP tool-call activity
Every tool call, configuration export, and token issue or revoke of an MCP service leaves an activity record, so you can confirm who used which client to call which tool when.
Procedure
- Open 「Admin Console › Capabilities › MCP Services」, open the target service, and choose the 「Usage」 tab.
- The page top shows service status, rate-limit and circuit-breaker status. 「Call trend」 can switch among 「Business calls」, 「Protocol activity」, 「All activity」 and choose a time range. Below it shows call volume, success rate, average latency, P95 latency, and current concurrency.
- In 「Recent calls」, look at each call. You can filter by user with 「All callers」 at the top right.
- Click a row to view 「Call payload」: body and headers of the four legs Client request, Request to upstream, Upstream response, Response to client.
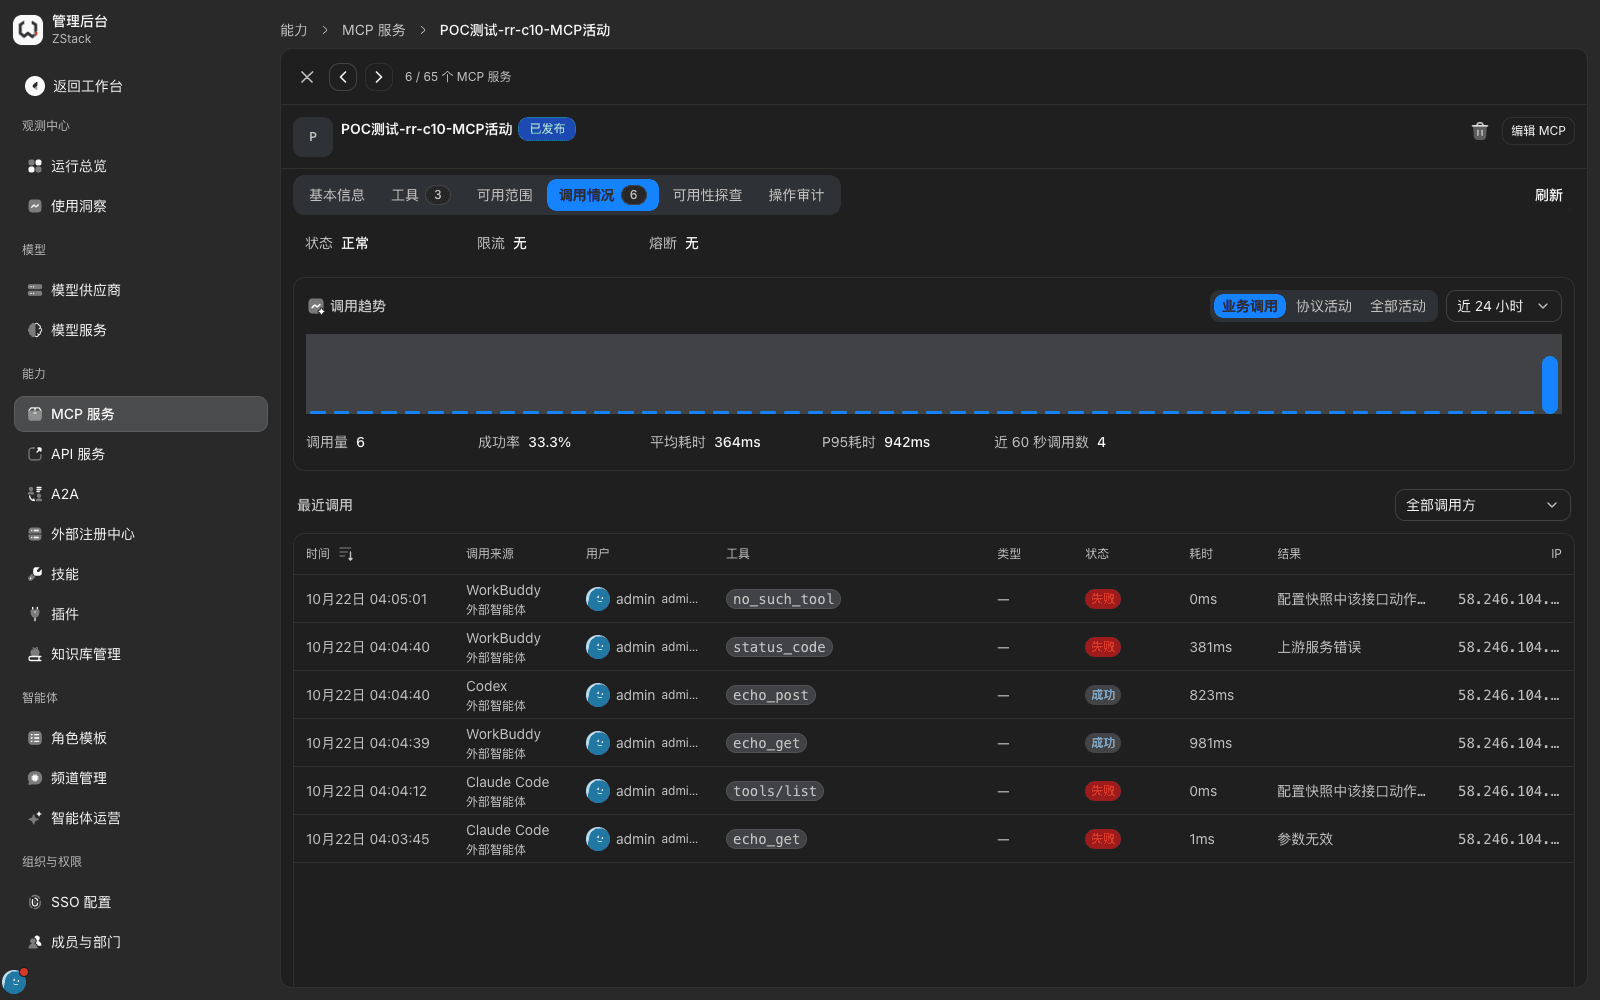
「Recent calls」 lists time, call source (client name and source entry), user, tool, type (the tool's side-effect type), status and result (a failure gives a reason, for example 「Upstream service error」, 「Invalid arguments」, 「Action is not active in the snapshot」), latency, and source IP. To look across services, add 「Call type = MCP call」 or 「MCP tool」 in 「Operations overview › Requests」. You can use the same request detail as for model calls.
Control-plane events and audit
- A member exporting MCP connection configuration, issuing a token, or revoking a token in the workspace is all written to that service's activity records (「All activity」).
- Token issue and revoke are also written to 「Admin Console › Audit & compliance › Operation audit」, recording actor, object, time, and source IP.
- A token in connection configuration is shown only once and has an expiry. Activity records and audit show only the token fingerprint prefix, never the full value.
20.7 Session diagnosis and policy hits
Session diagnosis: Usage insights automatically runs diagnostic rules on recent sessions, folds the same class of phenomenon into an 「issue」, and gives impact, cost, cause analysis, and fix suggestions.
- Open 「Admin Console › Observability › Usage insights」 and choose the 「Issues」 tab.
- The list is ordered by severity, issue, owner, affected sessions, count, cost, last-15-day trend, and status. Use 「Filter」 to narrow by owner or status.
- Click an issue to enter the detail. Read cost, affected sessions, count, last seen, daily occurrence, and cause analysis in 「Overview」. Switch to 「Evidence」 to look at matched sessions.
- After handling, choose a disposition status in 「Mark as」 at the top right. The system rechecks automatically after the observation period.
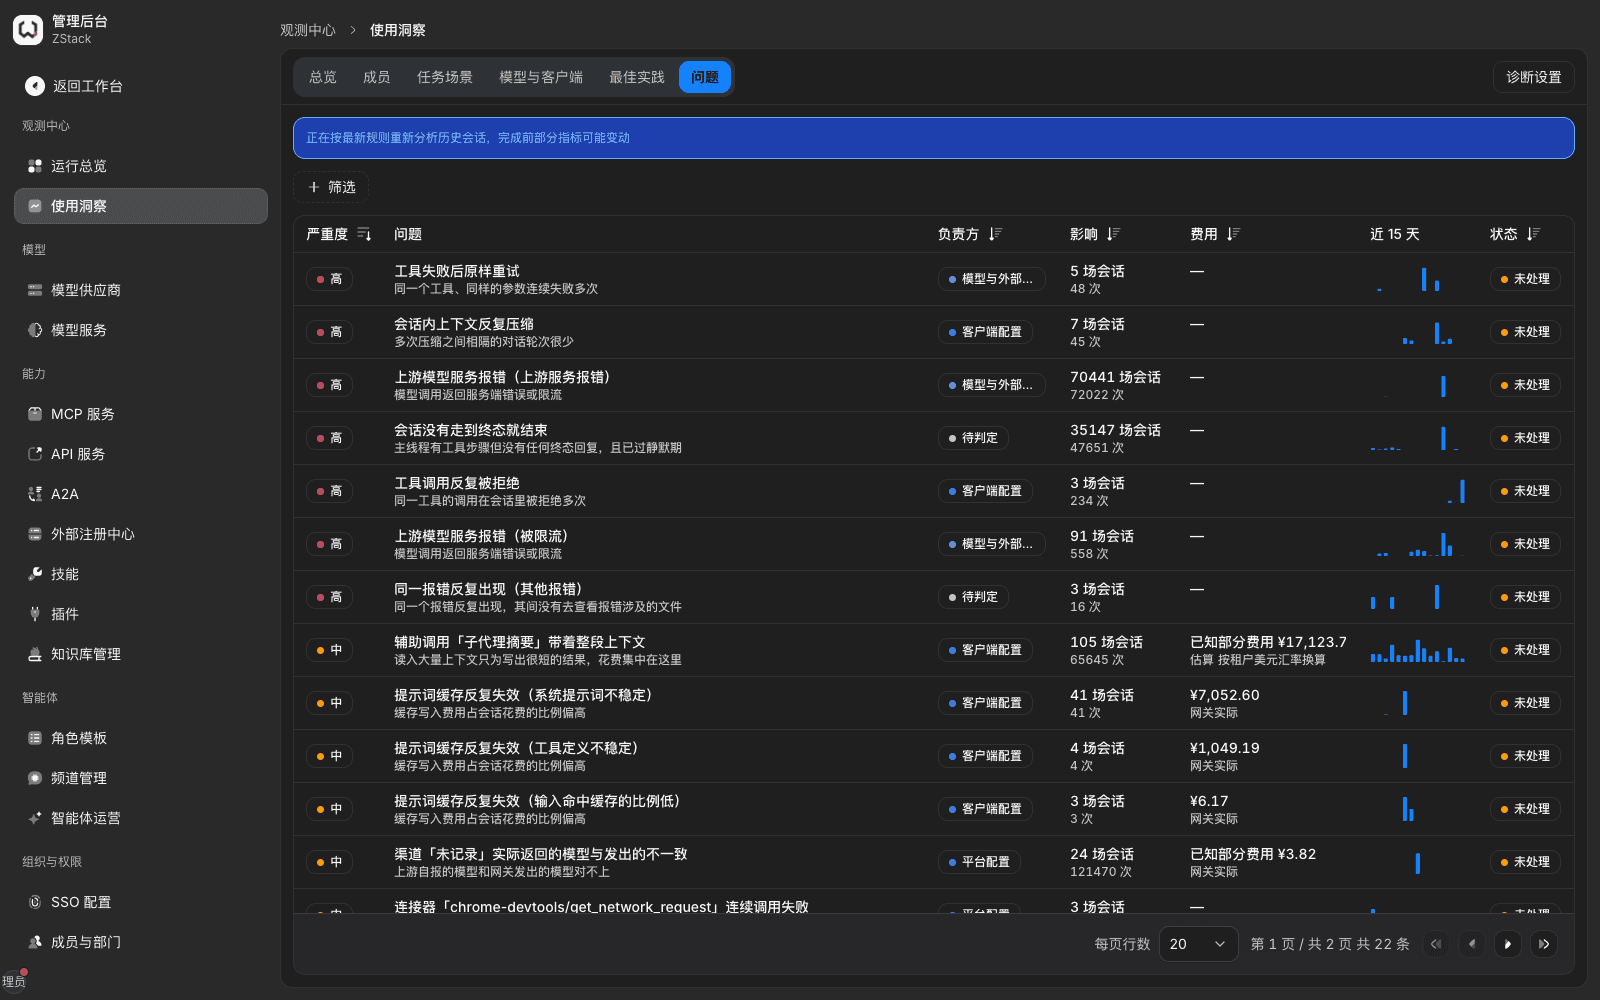
Note: cause analysis has a generation time. Data after that is still updating; use the key numbers at the top of the page. The first screen loads slowly; wait until metrics and the list appear before you operate. The 「Evidence」 tab does not provide drill-down to a session detail item by item.
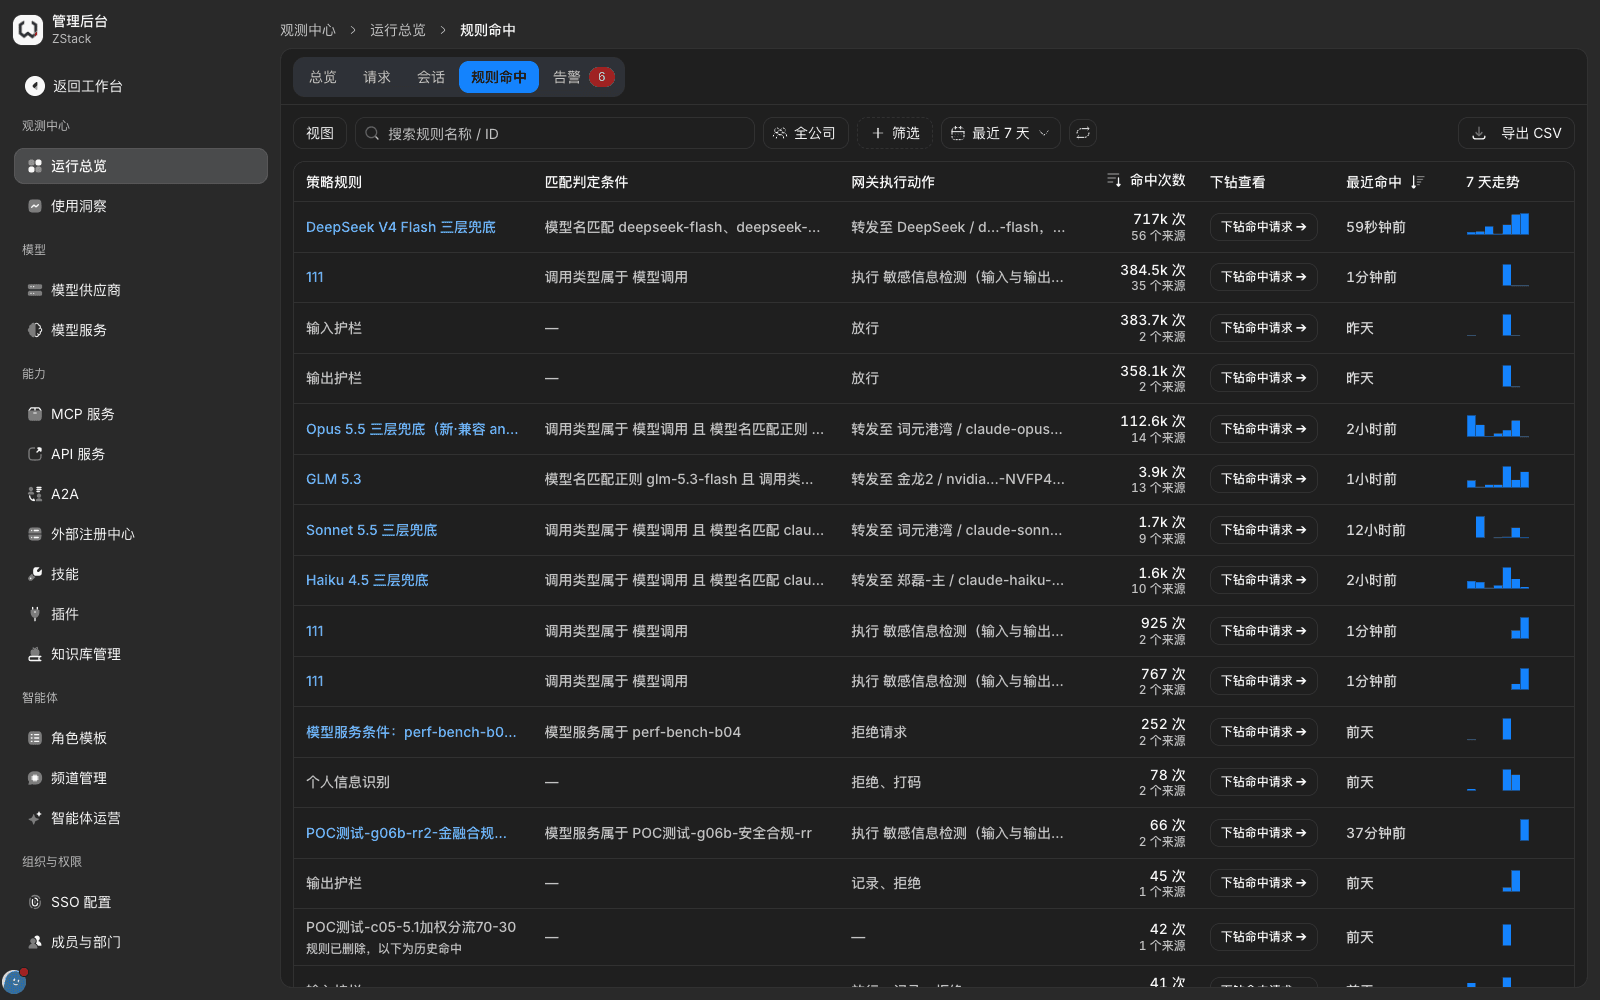
Policy hits: the 「Rule hits」 tab summarizes, per rule, how policies matched in the time window.
- On 「Operations overview」, choose the 「Rule hits」 tab and pick a time range (default last 7 days).
- The list shows per rule the policy rule, match conditions, gateway action, hit count and source count, drill-down, last hit, 7-day trend. The search box can search by rule name or ID.
- Click 「Filter › Action」 to filter by Allow, Reject, Reroute, Rewrite, Degrade, Rate-limit.
- Click a rule's 「View matching requests ➔」. The page switches to the 「Requests」 tab with a 「Matched policy」 filter already applied. Open one and check the action and result in 「Routing & changes › Hit records」.
Note
- The list is a per-rule summary, not a per-hit record. Per-hit records are in the drilled-down request list or the request detail.
- Redaction-class actions are shown in 「Gateway action」 with descriptions such as 「Continue after redaction」, and are grouped into the corresponding action type when you filter. A deleted rule that still has historical hits is annotated.
- In some cases, drilling down on a guardrail-class rule returns empty. Then use the 「Requests」 tab and filter that rule directly by 「Matched policy」.
20.8 Traffic spikes and circuit-breaker events
When to use this: traffic is abnormal, an upstream circuit-breaks, or cost spikes, and you need to confirm what happened and how large the impact is.
Procedure
- On 「Operations overview › Overview」, look at 「Traffic tide and two-way pressure」. Compare current QPS with upstream generation and prefill-token trends, and judge whether requests increased or each request got longer.
- Use 「Filter」 to narrow to a suspicious access credential or model, and watch its request volume and failure rate (section 18.3).
- Open 「Admin Console › Operations & Troubleshooting › Alert rules」, click 「Add rule」, and in 「Metric」 choose the signal to watch: call volume 「Model call volume」, rate limiting 「MCP rate-limit count」 and 「Rate-limit queue timeout rate」, cost 「Average cost per call」, latency 「Model-call P95 latency」 and 「Gateway latency P95 (queue + processing)」, policy events 「Policy hits」, 「Policy-block ratio」, 「Policy execution errors」, 「Failover ratio」 (section 22.3).
- To judge a spike or a drop, set 「Aggregation」 to 「Relative change versus baseline」 and fill 「Baseline window」 (no shorter than the stats window). The ratio is the stats-window reading divided by the baseline-window reading. 「Greater than 3」 means it rose to more than 3× the baseline; 「Less than 0.3」 means it fell below 30% of the baseline.
- On 「Operations overview」, choose the 「Alerts」 tab and look at alert records, latest values, and status changes.
What you will see: under each custom rule name in the rule list is the full condition, made of metric, stats window, aggregation, comparison, and threshold. When a duration is set, it fires only after the condition stays true for that long.
Note
- When the baseline-window reading is very small, the ratio is noisy, for example an idle hour of one or two calls dropping to 0. Use 「Baseline floor」 to exclude those intervals: for count metrics, fill a per-second rate; for others, use the same unit as the metric.
- Alert rules apply only to this tenant. A rule with no notification channel goes to this tenant's channels that subscribed to 「Alerts」 and have confirmed receipt of a test message. If there is no such channel, it is only recorded inside the platform (section 19.8).
Capability notes
| Capability not provided | What to do instead |
|---|---|
| The full per-request rule-evaluation process (which rules were evaluated, why they did not match) | Look at actually matched rules in 「Hit records」. Before a rule goes live, verify with the traffic-rule simulate function (Chapter 15) |
| A prompt-cache hit mark on a single call | Look at cache-hit tokens in 「Tokens & usage」 and in the session 「Summary」 (section 18.4) |
| A diff view on the response direction (upstream response → response to client) | Open the 「Upstream response」 and 「Response to client」 bodies separately and compare (section 20.2) |
| Replay a request back to the upstream | Replay with the session timeline and 「Client trajectory」. To reproduce, export the payload and have the caller send it again (section 20.5) |
| Pack as a single evidence pack (originals, signature, and hash inventory) | Use session 「Export JSONL」 and 「Export PDF report」. Audit integrity is in Operation audit (section 19.6) |
| Filter MCP activity by event type (configuration export, token issue, revoke) | Switch 「Usage」 to 「All activity」, or filter by action in Operation audit (section 20.6) |
| Circuit-breaker count, duration, and recovery statistics | Filter 「Requests」 by TRAFFIC_CIRCUIT_OPEN and count, together with the 「Traffic tide and two-way pressure」 trend (section 20.8) |
| Anomaly-interval marks on the dashboard | On 「Requests」, filter by latency range or result to locate calls in the anomaly interval (section 20.1) |
| Keyword search on the session list | Enter from the request-detail 「View this session」, or filter by client, source, diagnostic-issue category (section 20.5) |
Previous: 19. Observability entries, data sources, and permission boundaries · Next: 21. Problem diagnosis and handling
19. Observability entries, data sources, and permission boundaries
Full-length chapter. Content is checked against the 2026.10 mainline code and the live console; menus and features depend on the current license, account permissions, and delivered environment.
21. Problem diagnosis and handling
Full-length chapter. Content is checked against the 2026.10 mainline code and the live console; menus and features depend on the current license, account permissions, and delivered environment.