22. Alerts, notifications, retention, export, and operation audit
Full-length chapter. Content is checked against the 2026.10 mainline code and the live console; menus and features depend on the current license, account permissions, and delivered environment.
Back to overview · Full table of contents · Download full PDF
This chapter: for tenant administrators, operations, and auditors. It covers four things: turn call anomalies into alerts that can be pushed to the duty group; decide how long call records are kept; export usage data for reconciliation; query audit, verify integrity, and export evidence.
| Function | Entry | Licensed module |
|---|---|---|
| Alert rules, silences, templates, notification channels | Admin Console › Operations & Troubleshooting › Alert rules | Basic |
| Alert records | Admin Console › Observability › Operations overview › 「Alerts」 tab | Basic |
| Report export | Admin Console › Audit & compliance | Basic |
| Data retention | Admin Console › System Settings › Global settings › 「Data retention」 tab | Basic |
| Operation audit, archive and verification, evidence export | Admin Console › Audit & compliance › Operation audit | Full-chain audit |
The pages above are for tenant administrators, operations, auditors, and system administrators. Ordinary members who visit are sent back to the member-side pages; calling the audit API returns 403 PERMISSION_DENIED.
22.1 What an alert is made of
The 「Alert rules」 page has four tabs. Alert records are viewed in 「Operations overview」:
| Part | Contents | Where |
|---|---|---|
| Alert rules | Built-in alerts (for example 「A guardrail blocked content once」), two rules preset for a new tenant, and rules you add | 「Alert rules」 tab |
| Silences | Stop outbound delivery for a specified time; alerts are still recorded | 「Silences」 tab |
| Templates | Save a set of rule on/off, thresholds, duration, severity, and notification channels, so you can switch among duty baselines | 「Templates」 tab |
| Notification channels | DingTalk, Feishu, WeCom, webhook, email; channels that subscribed to 「Alerts」 receive this tenant's alerts | 「Notification channels」 tab |
| Alert records | Start time of each trigger, latest value and threshold, status, and notification result | 「Alerts」 tab of 「Operations overview」 |
Configuration order: create a channel first, subscribe to 「Alerts」, and confirm receipt of a test message; then enable built-in alerts or add a rule; finally rehearse handling once. If you reverse the order, the rule has already fired but no channel can receive it.
Where alerts go: when a rule specifies no notification channel, the alert goes to every channel in this tenant that is enabled, has confirmed receipt of a test message, and has subscribed to the 「Alerts」 event. When a rule specifies notification channels, it goes only to those channels. If no channel meets the conditions, or a channel subscribed to alerts but has not confirmed receipt, a persistent prompt sits at the top of the 「Alert rules」 page and the 「Notification channels」 tab, and names the channels not yet confirmed.
22.2 Create and verify a notification channel
When to use this: alerts need to go to a duty group, a duty mailbox, or a self-built receiver. A new channel's verification status is 「Waiting for receipt confirm」. Only after you send a test message and confirm receipt can it take real alerts.
- Open 「Admin Console › Operations & Troubleshooting › Alert rules」, switch to the 「Notification channels」 tab, and click 「Add channel」.
- Fill 「Name」 and 「Type」 (DingTalk, Feishu, webhook, WeCom, email) and the receive address. Email can choose people, a department, or an external mailbox. DingTalk and webhook can fill a signing secret for the receiver to verify the source. In 「Event types」, tick the events this channel receives; by default only 「Alerts」 is ticked. Ticking 「Alerts」 means this channel receives this tenant's alerts.
- Click 「Create」. In that row's 「⋯」 menu, click 「Send test message」. After the receiver confirms it arrived, click 「Confirm receipt」 in the same menu. Verification status becomes 「Verified」, and from then on the channel starts receiving alerts.
What you will see: list columns are name, type, verification status, last delivery, event types, created time, and actions. The masked address is under the name. A failed delivery states the reason, such as 「Failed · network unreachable」. There are 9 event types: Alerts, quota soft/hard over, daily usage summary, agent run completed, export completed, budget over, weekly session-diagnosis report, announcement.
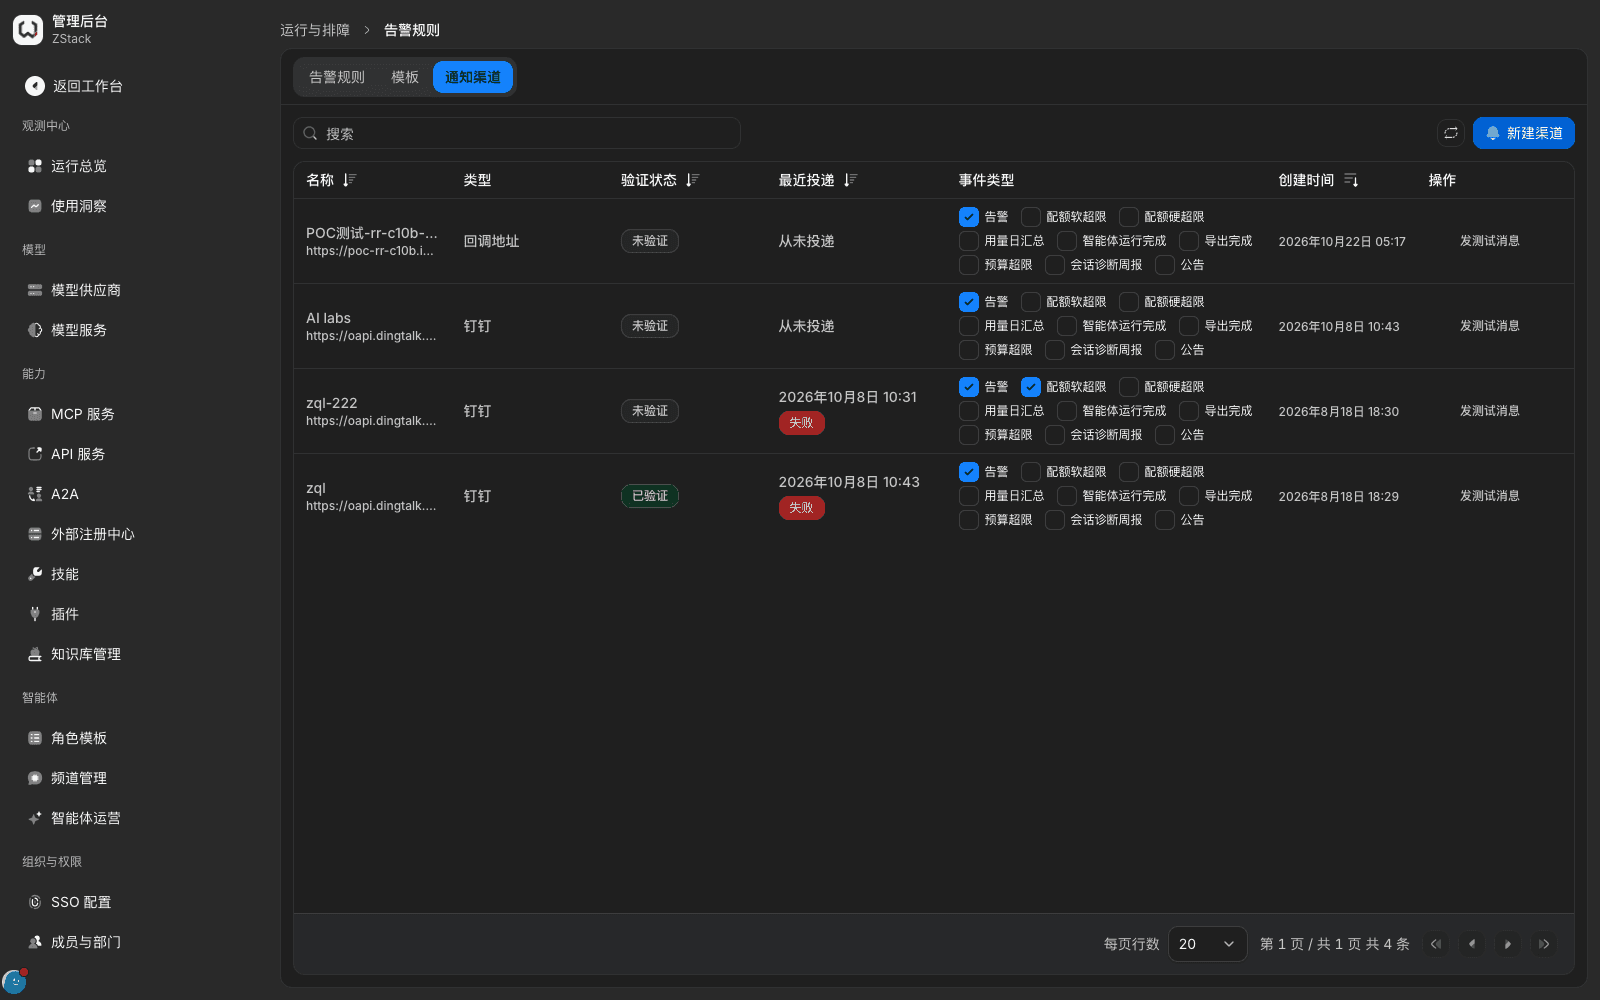
Note: a rule's 「Notification channels」 lists only channels that are enabled, verified, and subscribed to the 「Alerts」 event. If you cannot pick one, check those three first. Webhooks are constrained by the platform outbound policy; delivery fails immediately when the domain cannot be resolved or points at a restricted intranet address. A successful test only means it was reachable then; fire one real rule again before you enable it for production. After you unsubscribe from 「Alerts」 or delete a channel, rules no longer specify that channel. When a rule therefore specifies no channel, it goes to channels that subscribed to 「Alerts」.
22.3 Add an alert rule
When to use this: you want a notification when the policy-block ratio rises, a rule execution errors, failover becomes frequent, or the model-call failure rate rises.
- On the 「Alert rules」 tab, click 「Add rule」, fill 「Rule name」 (required), and in 「Metric」 choose the metric to judge. The dropdown lists only metrics available to this tenant.
- When the metric has dimensions, 「Group by」 appears. Unticked, judgement is merged for the whole tenant. Ticked, judgement is per selected dimension, and each group alerts on its own. For example, tick 「Policy rule」 on a policy metric, and each rule is judged on its own. After grouping, each group of a ratio metric has fewer samples, so also fill 「Minimum samples」.
- Choose 「Aggregation」 and fill 「Window」 (default average, 5 minutes). Choose 「Comparison」 (default 「Greater than」) and fill 「Threshold」. When the selected metric supports a sample threshold (see 「Note」 below), 「Minimum samples」 appears under 「Window」 and can be left empty.
- Fill 「Duration」: the condition must stay true for that long before it fires. 0 means it fires on the first match. Choose 「Severity」 (「Warning」 or 「Critical」), tick 「Notification channels」, and click 「Create」.
What you will see: a new rule is enabled as soon as it is created. Under the rule name in the list is the condition made of metric, window, aggregation, comparison, and threshold; when 「Minimum samples」 is filled, the condition ends with a note that it is not evaluated while the count within the window (for example policy hits) is below that value. When you choose a ratio metric, the hint under the threshold is 「This metric is a ratio. Enter a decimal between 0 and 1, e.g. 0.2 for 20%.」
Common policy metrics (all can group by 「Policy category」 or 「Policy rule」):
| Metric | Meaning |
|---|---|
| Policy hits | Hits of routing, traffic, guardrail, threat-intelligence, and similar policies |
| Policy blocks, policy-block ratio | Times a match was blocked, and blocks as a share of hits |
| Policy execution errors, policy-execution-error ratio | Times the rule itself failed to run (for example a request rewrite failed, or the judge model was unavailable), and errors as a share of hits; not counted as blocks |
| Policy-hit subjects | Number of callers involved in hits |
| Failover requests, failover ratio | Requests that failed over, and their share |
How to choose aggregation: the dropdown lists only methods the selected metric supports. Count metrics (such as 「Policy blocks」) can use 「Delta」, 「Sum」, 「Per-second rate」. Metrics such as 「Policy-block ratio」 can use latest, average, max, min, and percentile. Ratios computed from the window total, such as 「Model-service attempt failure rate」, have only 「Average」. Most metrics can also use 「Relative change versus baseline」, for a spike or a drop. When you pick it, also fill 「Baseline window」 (no shorter than the stats window). The ratio is the stats-window reading divided by the baseline-window reading. 「Greater than 3」 means it rose to more than 3× the baseline; 「Less than 0.3」 means it fell below 30% of the baseline. When the baseline reading is very small, the ratio is noisy. Fill 「Baseline floor」 to exclude those intervals: for count metrics, fill a per-second rate; for others, use the same unit as the metric.
Note
- A shorter stats window is more sensitive and also easier to false-alarm, especially in low-traffic intervals: one of two calls blocked is a block ratio of 0.5. It is more obvious when computed per group. A group with only 1 sample can only be 0 or 100%. For ratio metrics, fill 「Minimum samples」: when the window has fewer samples than that, the rule does not judge, shows 「No data」, and gives the reason 「No data: the samples within the window are below the configured minimum sample count, so the rule is not evaluated」; if samples stay too few, an alert that already fired ends as 「No data」 and no recovery notification is sent. Samples count the metric's denominator, and the form description names the count: capability-call failure rate and capability-call success rate count 「capability calls」; policy block ratio and policy execution error ratio count 「policy hits」; API error rate counts 「API requests」; model-group attempt failure rate counts 「model-group attempts」. It cannot be set when the aggregation is 「change ratio against baseline」. Other ratio metrics (for example failover ratio) have no 「Minimum samples」; when you alert per rule, use a count metric, or lengthen the stats window and duration.
- After create, you can change threshold, duration, minimum samples (can be cleared), severity, notification channels, and on/off. Rule name, metric, group-by, aggregation, and stats window cannot be changed; create a new rule if you need to adjust them.
- A rule with no notification channel goes to this tenant's channels that subscribed to 「Alerts」. If every specified channel is disabled or has not confirmed receipt, the alert is recorded as 「The channels specified by the rule are currently unavailable」 and is not sent to other channels.
22.4 Enable built-in alerts, silence, and view alert records
- On the 「Alert rules」 tab, filter 「Type」 to 「Built-in」. Built-in alerts can only be turned on/off and assigned notification channels: in that row's 「More」 menu, click 「Choose channels」, then turn on 「Enable」. For example, 「A guardrail blocked content once」 records one alert when a guardrail rule matches, covering every guardrail category and entry.
- Check the two rules preset for a new tenant, and in the 「More」 menu click 「Edit」 to adjust thresholds to traffic: 「High model-service call failure rate」 (model-service attempt failure rate 5-minute average greater than 0.2, lasting 2 minutes) and 「Provider calls failing with no success」 (grouped by model service and provider, latest value in 15 minutes greater than or equal to 5). Both are 「Critical」. When you need to judge alerts by external MCP call volume or monthly spend, click 「Capacity and budget」 in the toolbar and fill the external MCP baseline QPS and monthly budget (yuan).
- For known intervals such as load tests or a change window, in the rule row 「More」 menu click 「Silence」 to silence only that rule, or on the 「Silences」 tab click 「Add silence」 to silence every rule in this tenant. Choose 「Duration」 (30 minutes, 2 hours, or until a specified time) and fill 「Reason」. To resume early, click 「End early」 on that row on the 「Silences」 tab.
- On the 「Alerts」 tab of 「Operations overview」, filter alert records by 「Status」 (firing, recovered in the last 24 hours) and 「Severity」. Click a record for detail. 「View records」 in the rule-row 「More」 menu opens that rule's records directly.
What you will see
- Alert records list start time, alert, status, latest value / threshold, severity, and notification result. The 「Notification」 column writes 「Sent outbound」, 「Silenced, not sent outbound」, or the reason it was not sent, for example 「No notification channel receives this severity」 or 「The channels specified by the rule are currently unavailable」. Records that were not sent outbound provide an entry in the detail to configure notification channels. Alerts produced by platform rules show 「Platform alert, not sent through this tenant's channels」 in the 「Notification」 column.
- The detail gives this alert's object, duration, end reason, same-rule trigger trend, status changes, and other records of the same rule. Call-failure alerts also list 「Top errors」, and you can click 「View calls」. Record the investigation and the handling result in 「Handling notes」.
- When the condition clears, the alert ends on its own; you do not need to close it by hand.
Save a duty baseline as a template: on the 「Alert rules」 tab, tick several custom rules and click 「Save as template」. To switch, on the 「Templates」 tab click 「Apply」 on the target template, check what each rule will change, then click 「Confirm apply」. Entries whose rule was deleted or whose channel is unavailable are skipped.
Note: during a silence, alerts are still recorded but not sent outbound. Alerts produced by platform rules are received by platform operations. A tenant cannot silence them, and handling notes are also filled by platform operations.
22.5 Query operation audit
When to use this: trace who changed a configuration and what changed; provide the operation evidence compliance needs. Requires the license to include the 「Full-chain audit」 module.
- Open 「Admin Console › Audit & compliance › Operation audit」. The default is 「Last 24 hours」; you can switch to 「Last 1 hour」, 「Last 7 days」, and similar.
- Search by actor, action, or object in the search box. Click 「+ Filter」 to add conditions (several apply together). Click a record for detail.
What you will see: each list row shows time, actor, action, object, source (region and IP), result, and a change summary. The detail has two tabs: 「Change」 lists every modification in three columns 「Field / Before / After」; 「Operation」 shows actor, time, object, source IP, and Retention, written as 「Queryable online until YYYY-MM-DD, then moved to archive」.
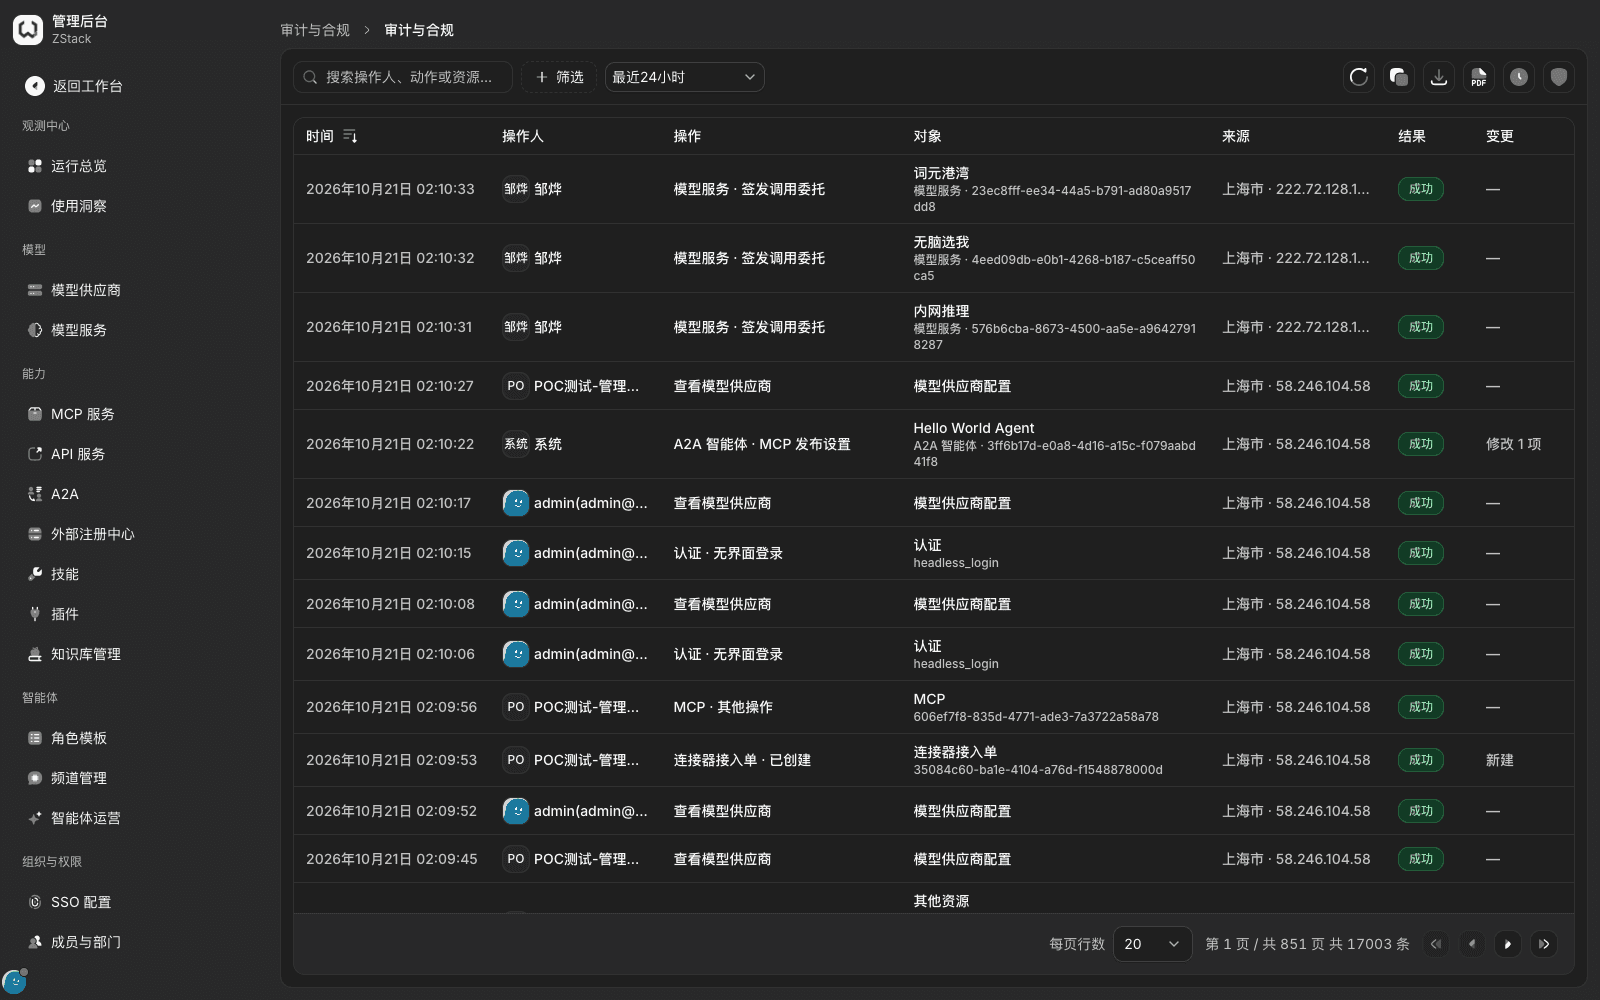
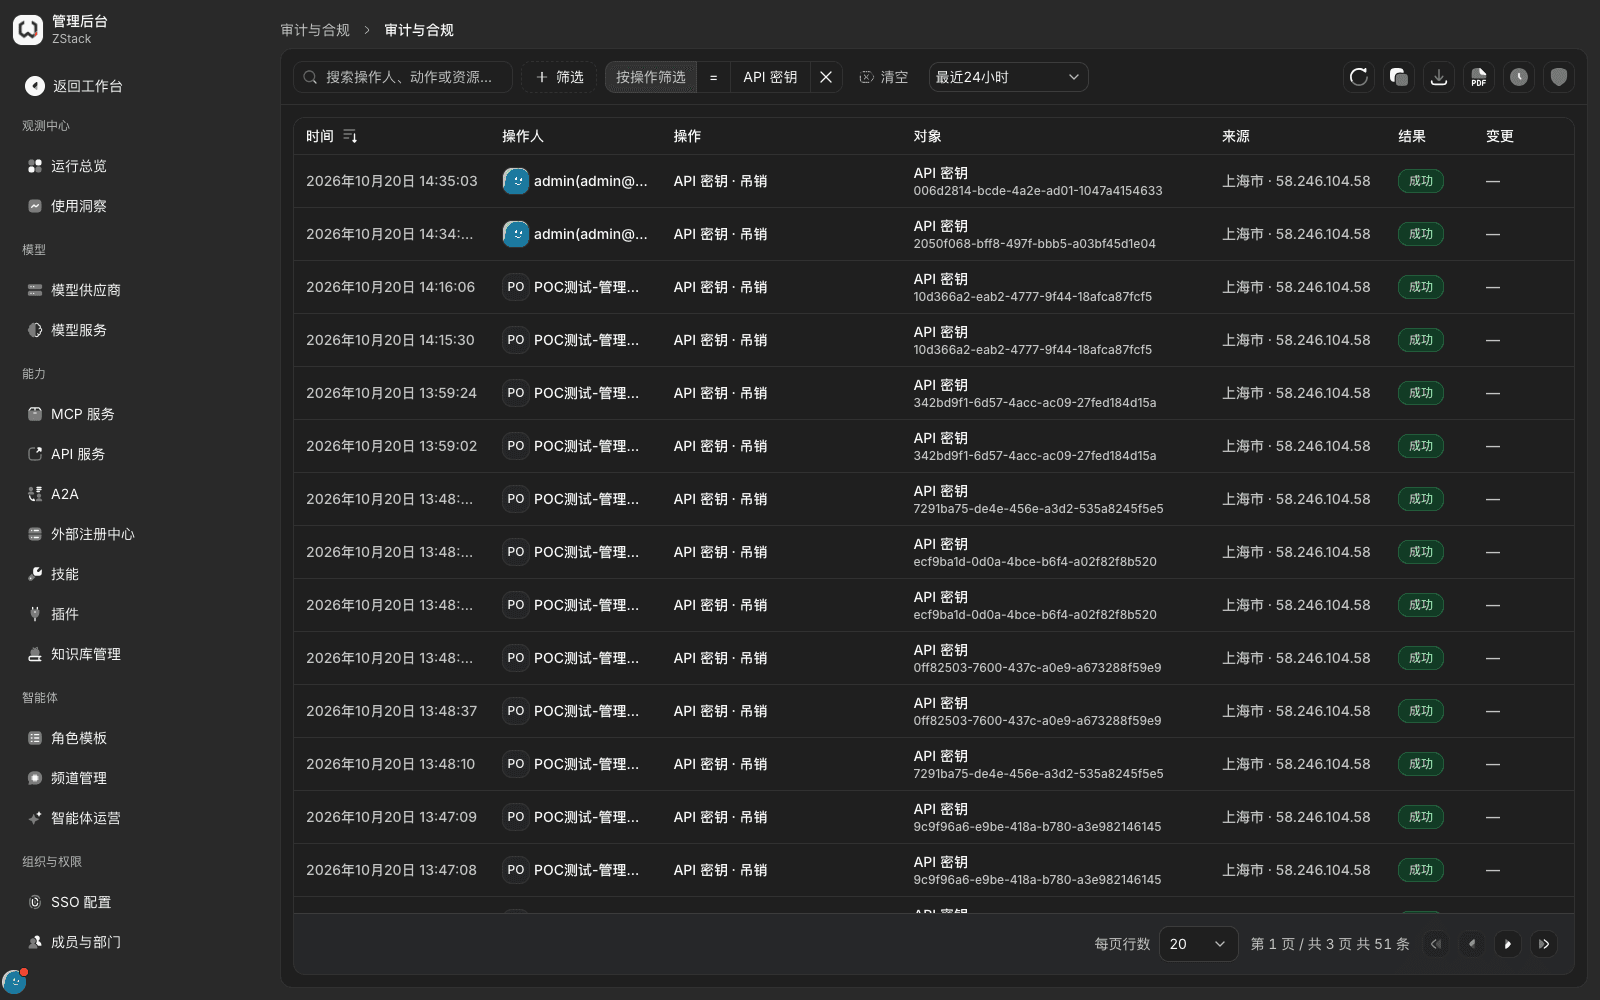
Note: an ordinary member who visits this page is redirected back to the member-side settings page. That is the permission design, not a fault. Details of model providers, models, model groups, MCP services, and similar have their own 「Operation audit」 tab, listing only that object's changes. The page address carries filter conditions; save it as a bookmark to pin an inspection view.
22.6 Verify audit integrity and view archives
When to use this: you need to prove audit records were not deleted or tampered with, or to seal audit and call logs by day. Audit records are chained by hash; verification checks that chain segment by segment.
- At the top right of the Operation audit page, click 「Archive and verification」.
- In 「Integrity verification」, look at running status and the latest result. To check immediately, click 「Verify now」 and wait for it to finish. Then look at batches by category in 「Archive batches」.
What you will see: when archive storage is not configured, the dialog top shows a red prompt 「Archive storage is not configured; audit records are not sealed」, and archive batches are empty. The verification result is 「Intact」 or 「Issues found · N issues」. Full verification time depends on the total number of records.
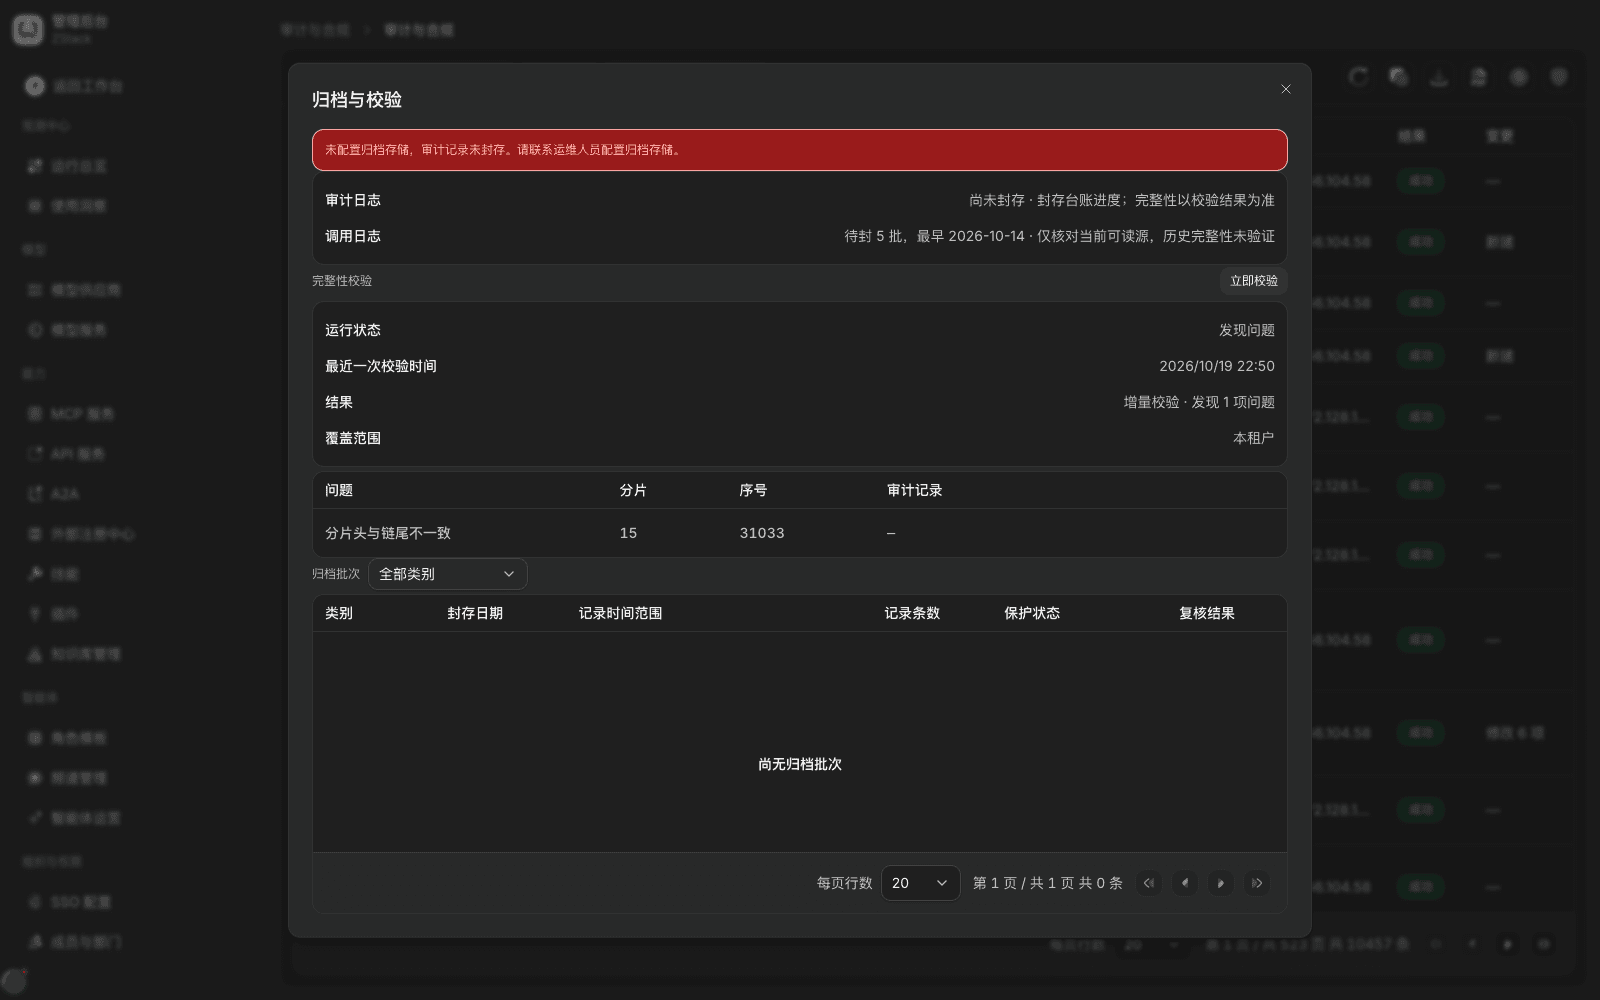
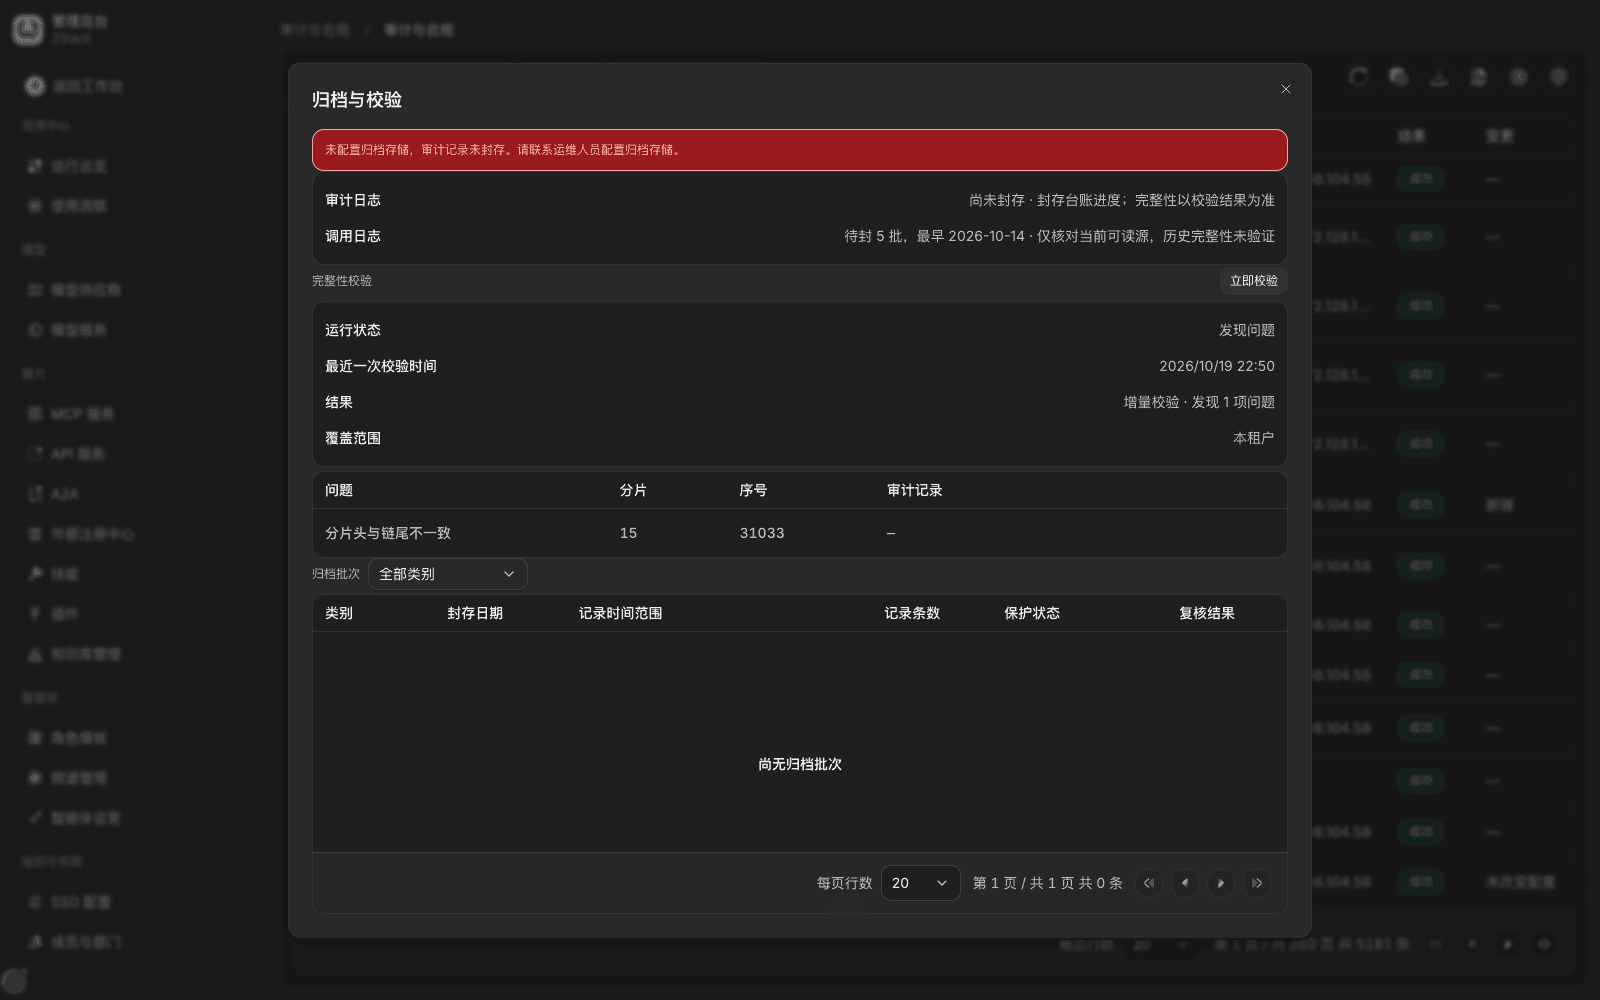
Note: the platform incrementally verifies new records on a fixed cadence. 「Verify now」 is an extra full verification; do not run it often. When the result is 「Issues found」, it gives only the number of issue items. The current release does not provide shard and sequence detail, or a download. To check item by item, export that interval's audit-evidence CSV and compare it on the platform side.
22.7 Export audit evidence
- On the Operation audit page, set the time range and filters.
- Choose an export method: 「Export audit evidence CSV」 (the browser downloads after 「Operation records exported」), 「Evidence PDF」 (a signed evidence is generated in the background), 「Copy visible rows CSV」 (copies only the current page). Click 「Export history」 to see generated PDF evidence.
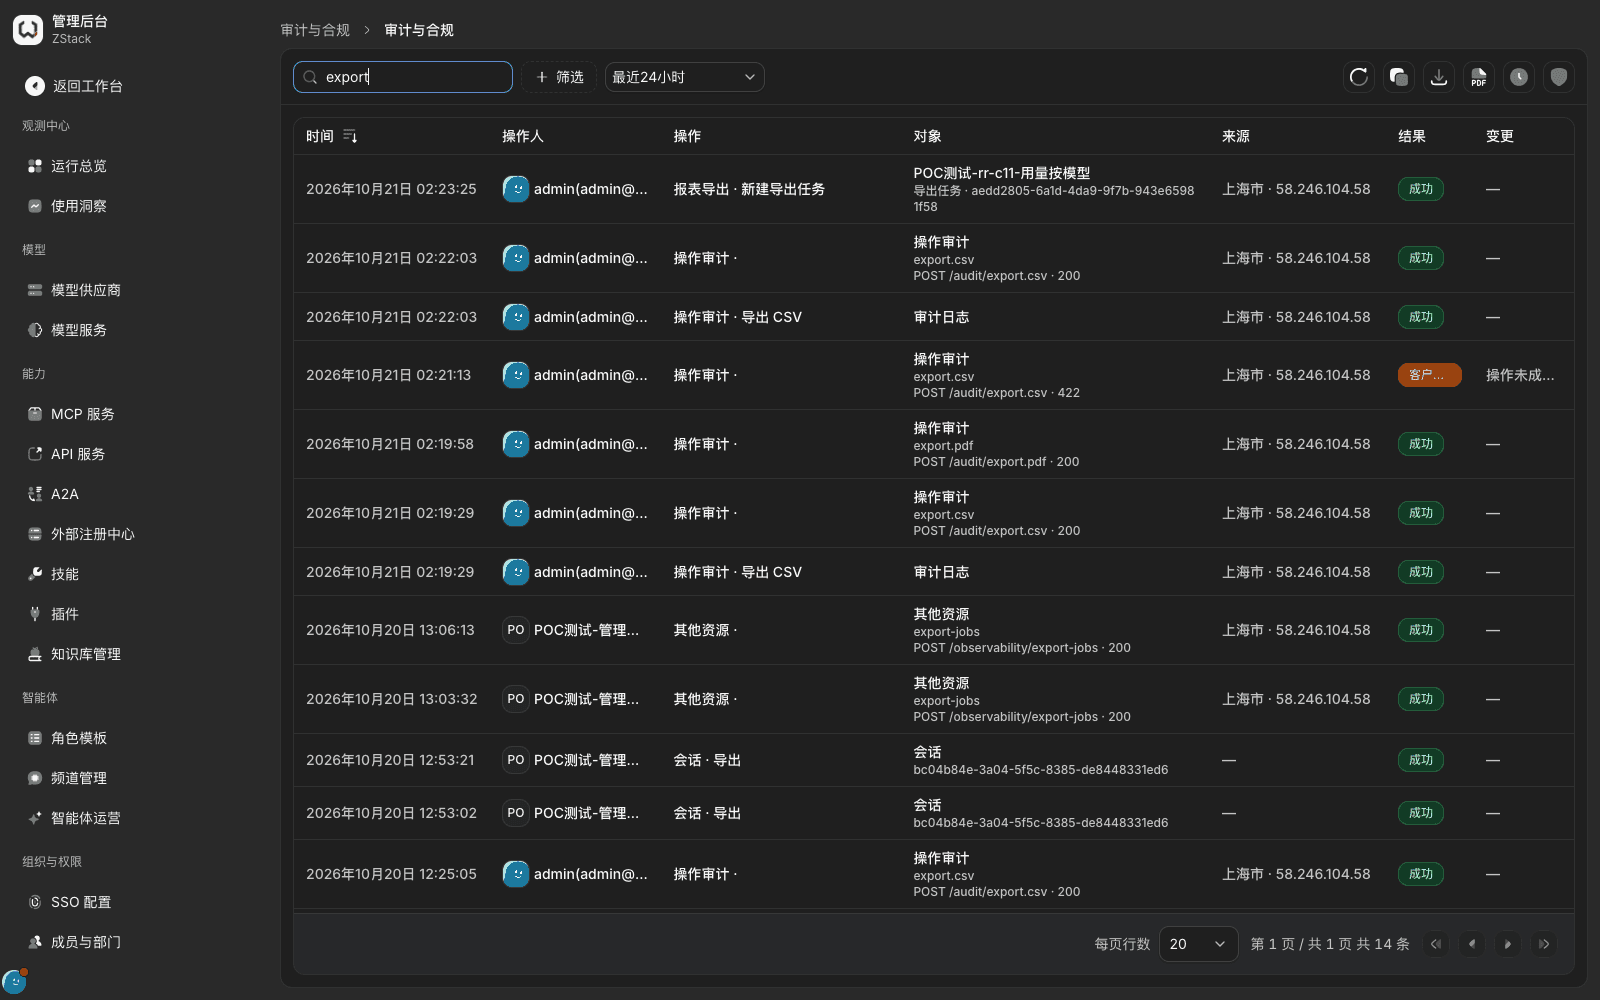
What you will see: CSV is UTF-8 (with BOM) and can be opened directly in a spreadsheet. Fields include id, timestamp, tenant_id, user_id, action, resource_type, resource_id, outcome, ip_address, request_id, detail, and similar. Export content is redacted: it contains no key plaintext, passwords, or tokens. detail keeps only request path, status code, and object identifiers. Guardrail hits record only type and count. Evidence PDF is not generated when integrity verification has not passed; it prompts 「Failed to generate the audit evidence PDF」 and states the reason. 「Export history」 lists only PDF evidence jobs. CSV downloads directly and does not enter history.
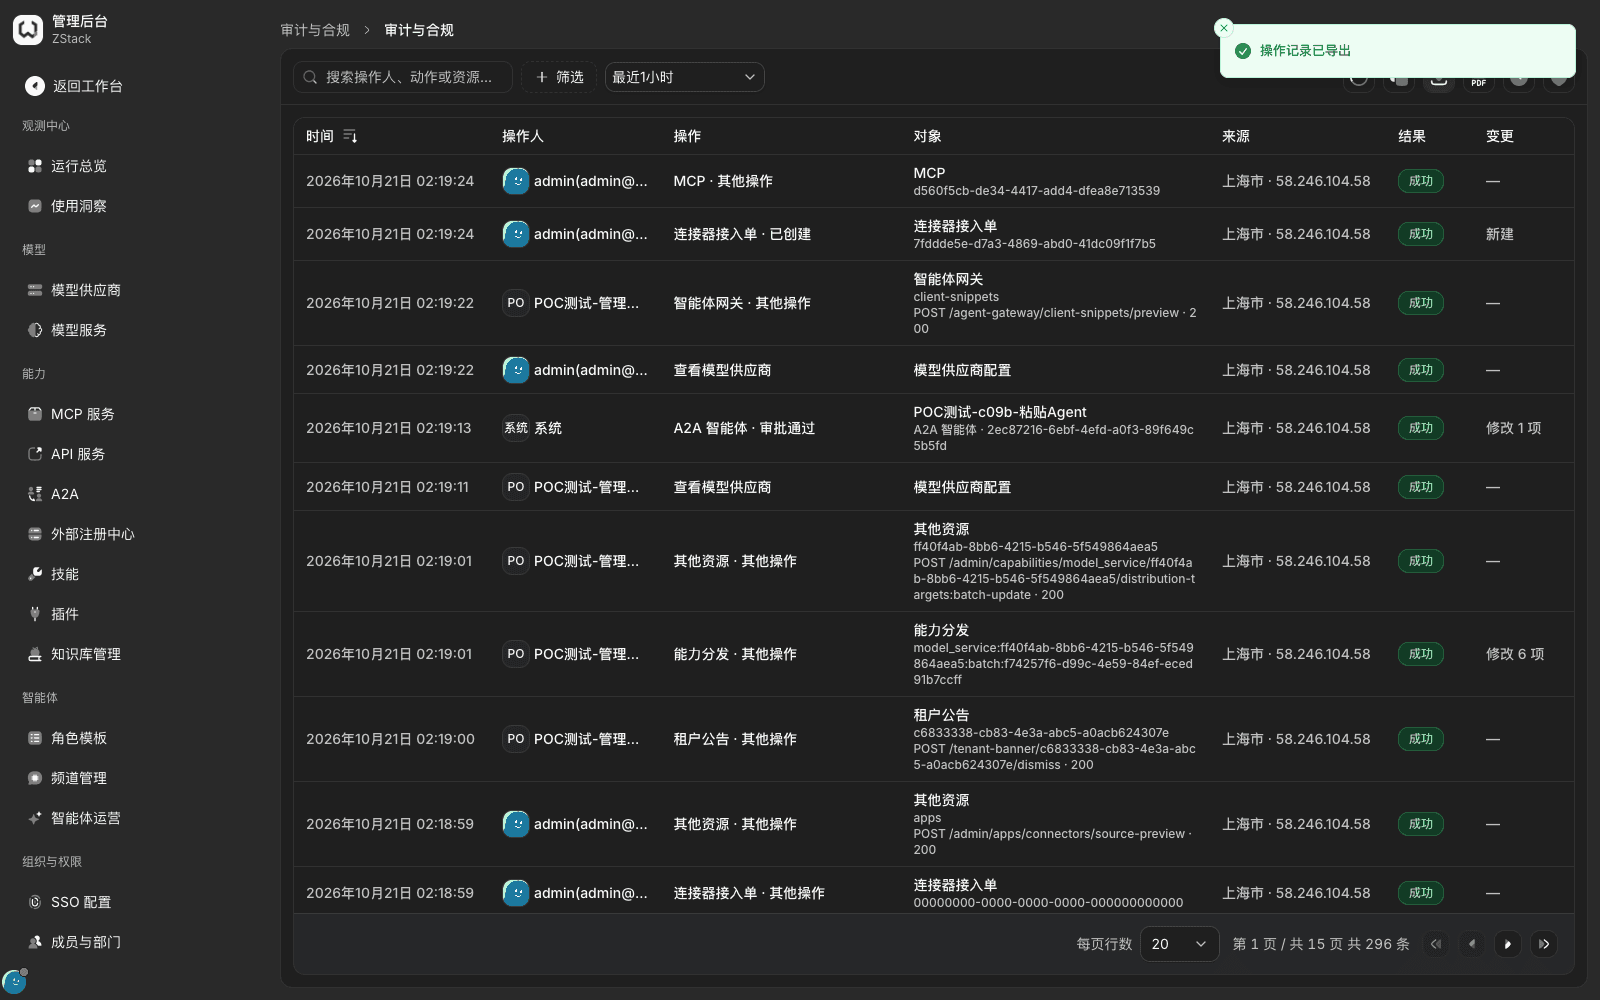
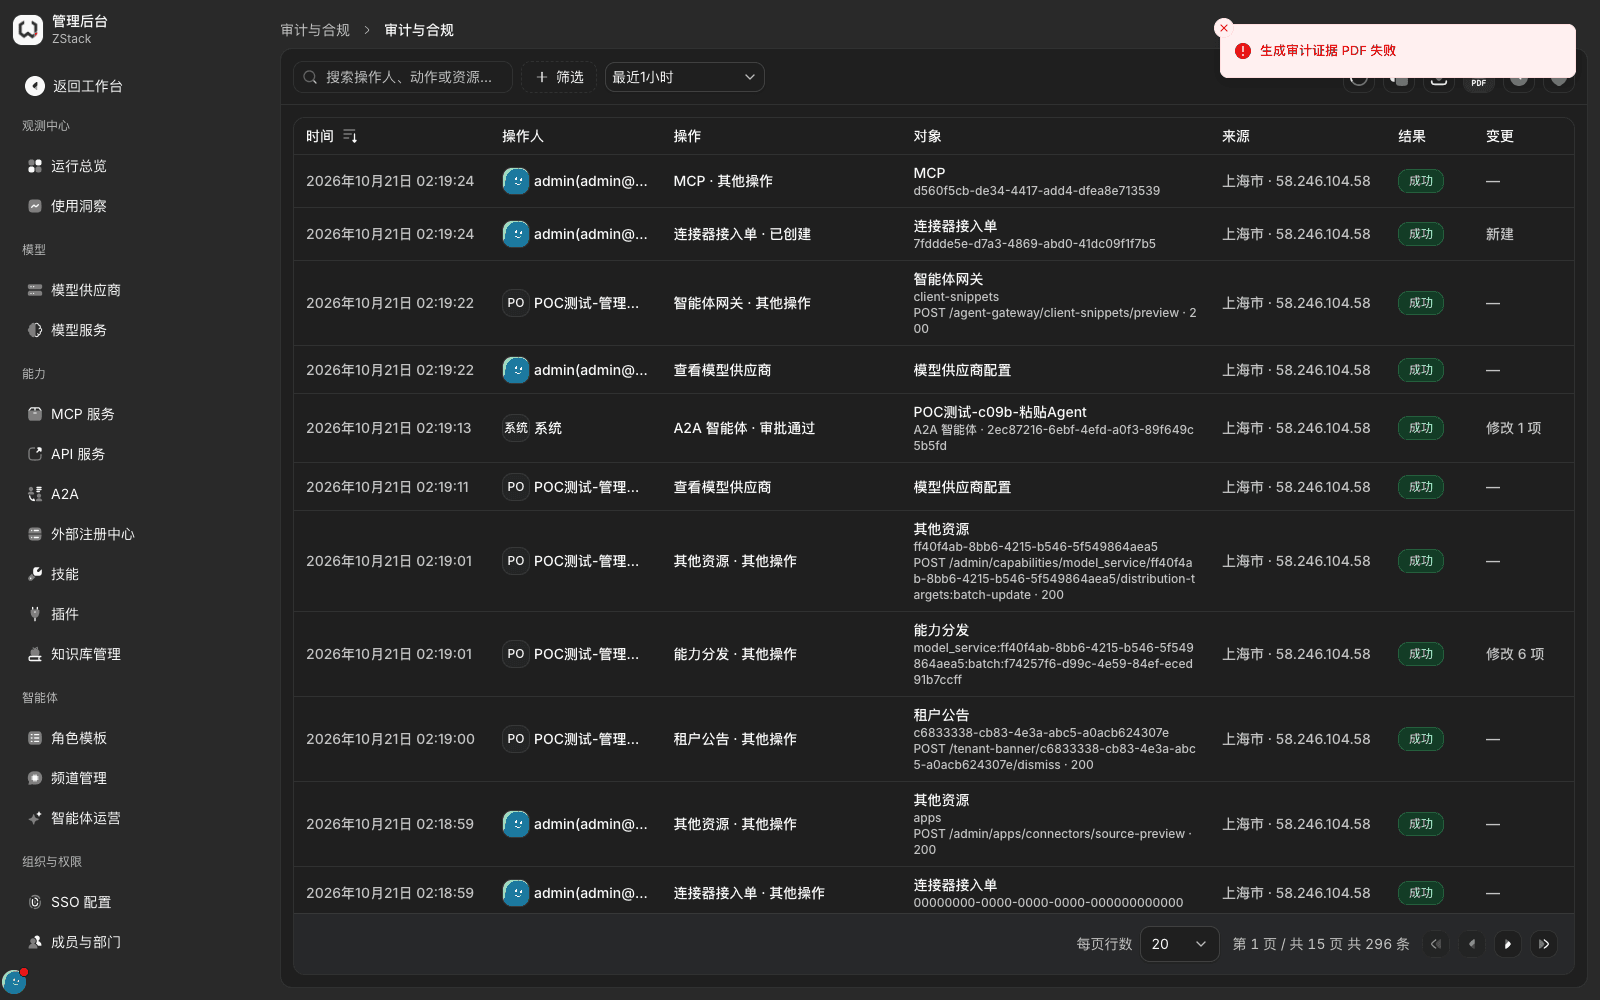
Note: each export itself is also written to Operation audit. When no time range is set, CSV defaults to the last 30 days. When you need a signed evidence file, fix integrity verification first. You can deliver CSV first and note that the signed file is pending.
22.8 Export call and usage data
When to use this: give call details or a usage summary to finance for reconciliation, cost allocation, or an enterprise data platform. When you export to object storage or a webhook, prepare the bucket or HTTPS receiver and credentials first.
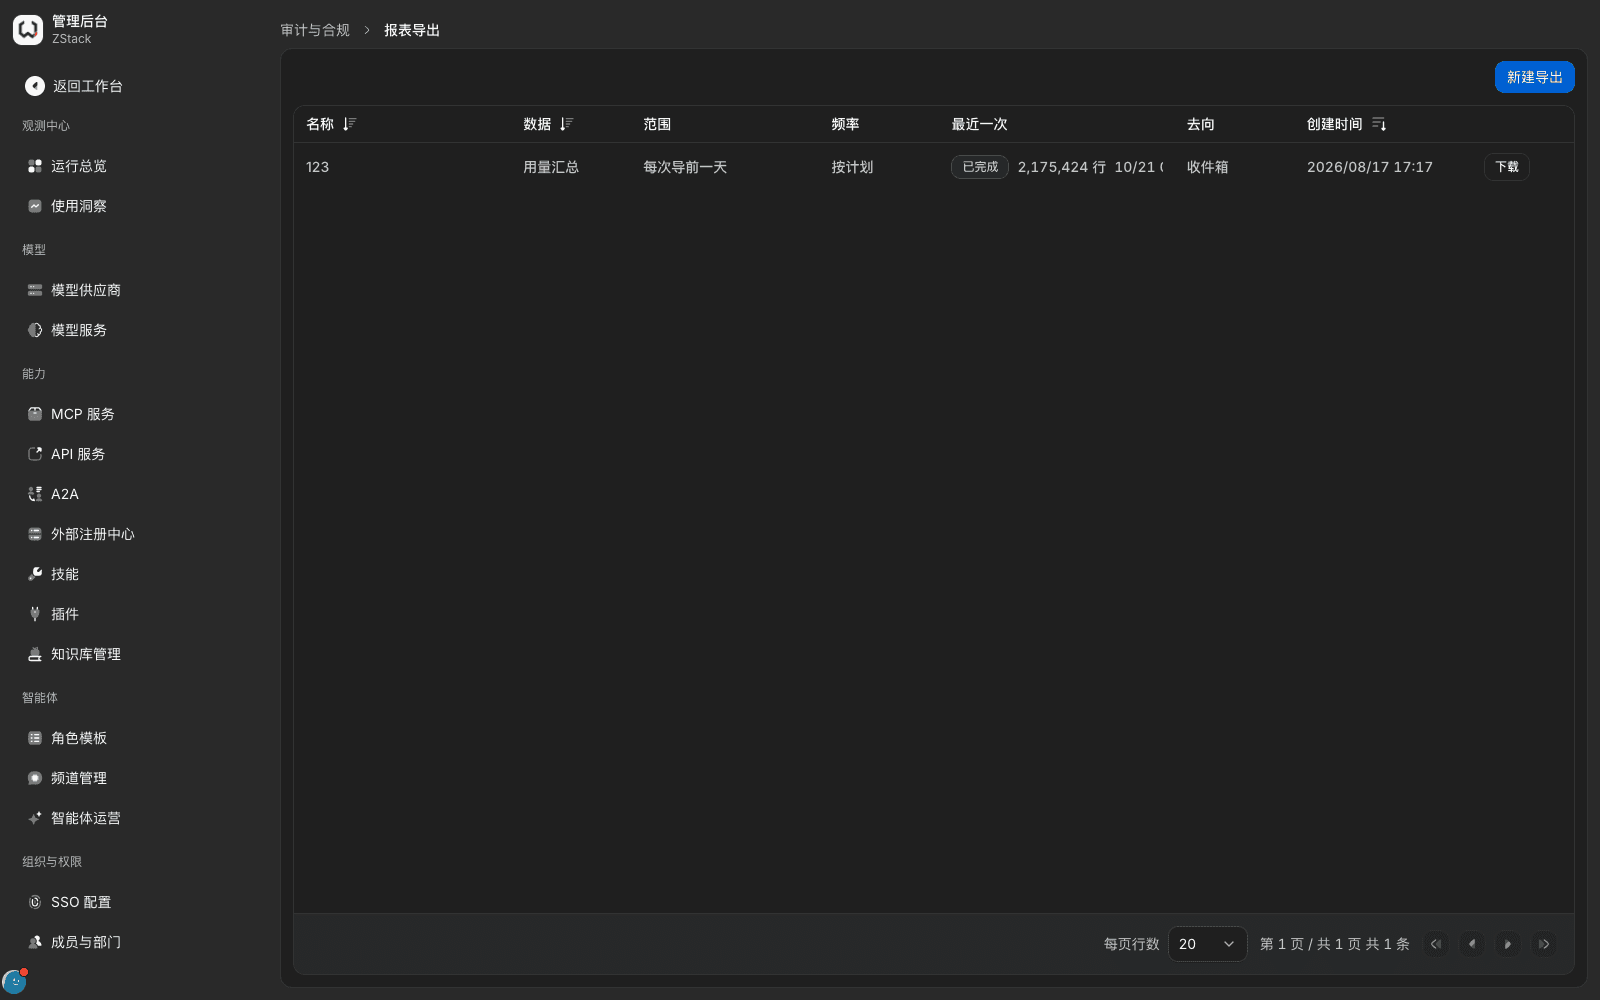
- Open 「Admin Console › Audit & compliance › Report export」, click 「New export」, and fill 「Name」.
- In 「Data」, choose 「Full call records」 or 「Usage summary」. When you choose 「Usage summary」, in 「Grouping」 choose detail rows, by model, by department, by user, by access credential, or by tag. In 「Frequency」, choose once, daily, weekly, or monthly (once needs start and end dates; a scheduled job exports the previous period).
- In 「Destination」, choose 「Inbox」, 「Object storage (S3)」, or 「Webhook」, then click 「Submit」.
What you will see: the list shows name, data, range, frequency, last run (status and row count), destination, and created time. Successful scheduled jobs keep running on plan. Failed jobs show 「Failed」; the detail drawer gives a readable Chinese reason. Creating an export is written to Operation audit, categorized as 「Report export · New export job」. Usage summary is CSV, with extra dimension columns by grouping. Full call records are NDJSON.
Note
- Files in the inbox have a retention period. For long-term keep, download and store them, or export directly to object storage. A large-range export (hundreds of thousands of rows) can reach hundreds of MB; schedule daily or narrow the range.
- Usage export grouped by model can fail in some cases. Retry with a narrower daily range first. If it keeps failing, export 「Detail rows」 and summarize yourself, and feed it back to the platform side.
- Export runs in the background. An unavailable receiver only fails the job; it does not affect business calls. Tick the 「Export completed」 event to know a failure immediately. When you choose webhook, the field label shows 「Webhook address」; that is a copy issue and does not affect filling.
22.9 Log retention and archive
When to use this: decide how long call records are kept for compliance, or control storage. Data-retention settings apply to the whole tenant. Confirm with audit and security owners before you change them.
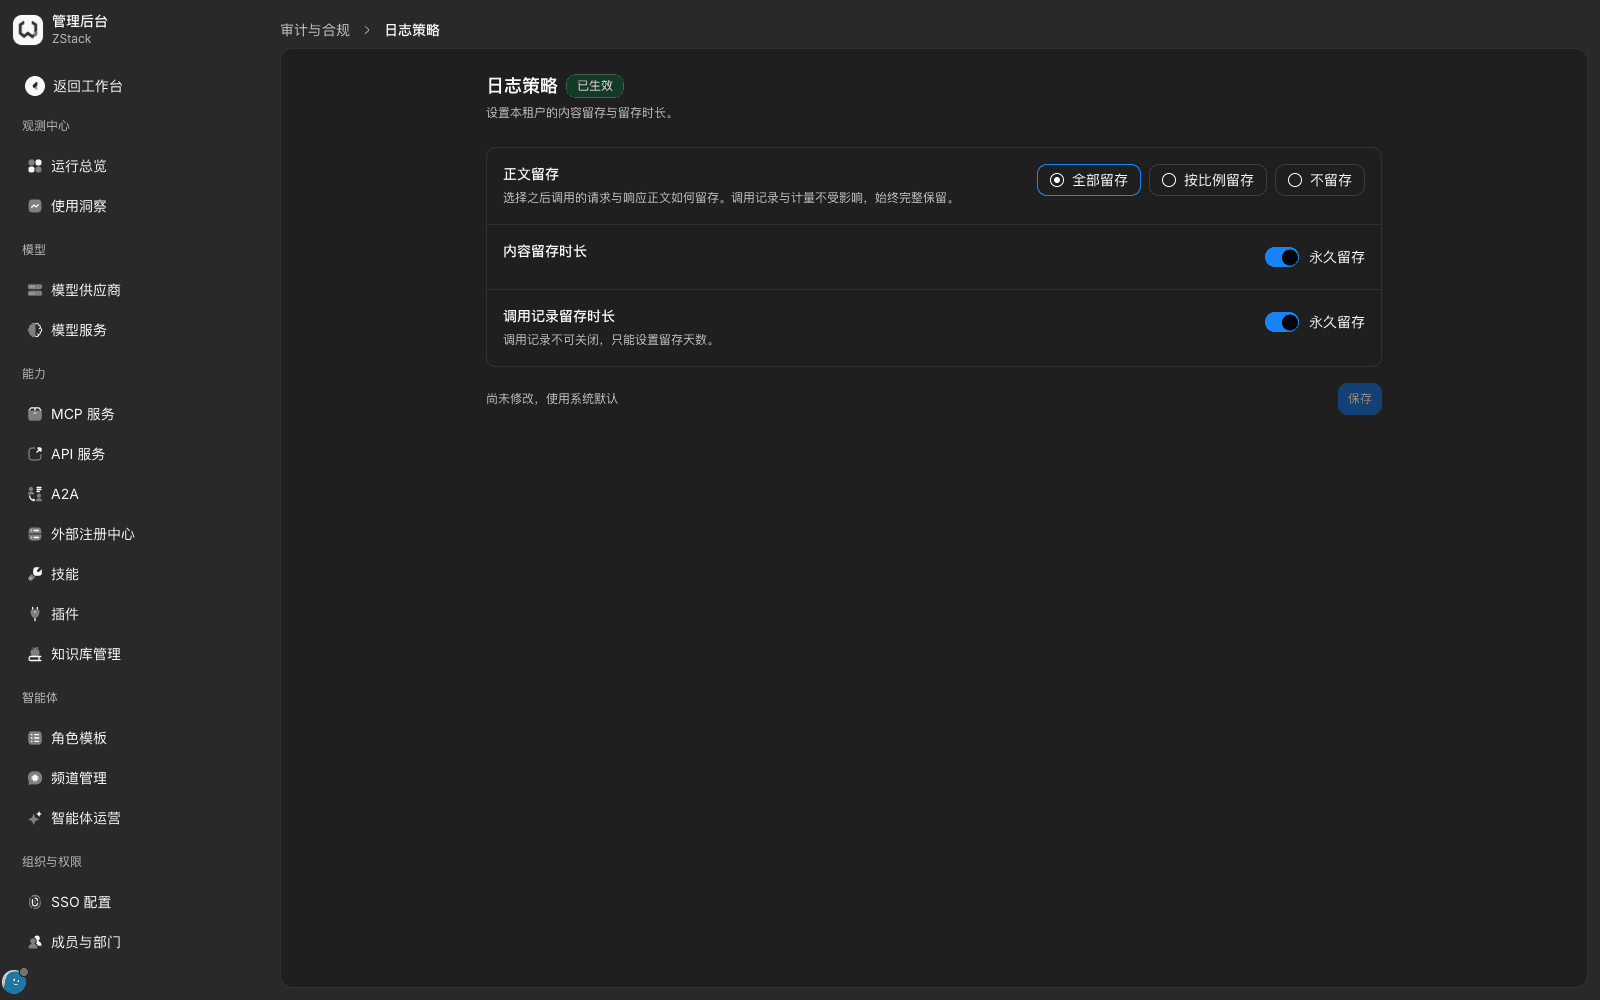
Open 「Admin Console › System Settings › Global settings › 「Data retention」 tab」. The default body is 「Retain all」, and both content and call records are 「Retain forever」. Choose the 「Body retention」 method, set 「Content retention duration」 and 「Call record retention duration」 separately (fill days after you turn off 「Retain forever」), then click 「Save」.
| Field | Notes |
|---|---|
| Body retention / share | Whether later request and response bodies are retained. Judged per session as a whole: a session is either all kept or all not kept |
| Content retention duration | How long retained bodies are kept |
| Call record retention duration | How long call records (time, caller, model, tokens, cost, status) are kept |
Note: the system default is 「Retain all」 and 「Retain forever」. It does not delete data automatically. Plan capacity from call volume and payload size. After you shorten retention, overdue data is deleted by the cleanup job and cannot be recovered. 「Retain a share」 affects only the body. Call records, tokens, and cost are always recorded in full. Operation audit is not controlled by data-retention settings, and is queryable online for two years. The current release does not provide a capacity-watermark alert for log storage, or wrap-around overwrite when it is full.
22.10 Administrator sign-in logs
When to use this: check whether an account signed in at an unusual time or place. Sign-in, sign-out, and session refresh are all recorded in Operation audit. The product does not provide a separate sign-in-log page.
Open 「Operation audit」, click 「+ Filter」, choose 「Filter by action = Authentication」. The list shows sign-in, sign-out, refresh, and similar records. Add 「Filter by outcome = Client error」 to look at failed sign-ins alone. Click a record to see the full source IP in 「Operation」.
What you will see: failed sign-ins are visible in the list. The detail detail is only {"method":"password","reason":"invalid_credentials"}.
Note: the current release's failed sign-in records do not record the attempted account; the actor is shown as 「System」. Searching by account therefore cannot find 「someone tried to guess my password」; you only see 「there was a wrong password at this time」. Account-dimension audit uses successful sign-in records.
Capability notes
| Capability not provided | What to do instead |
|---|---|
| Configure alerts by log keyword | A platform administrator filters by level and searches by keyword in platform runtime logs: 「Gateway › Nodes」 into the node detail, click 「View node logs」 (see Chapter 23) |
| Tenant-side log-storage capacity alerts, and wrap-around overwrite when full | Control capacity with retention days on the 「Data retention」 tab; host-level capacity alerts are owned by the platform side (see 22.9) |
| Real-time log shipping to syslog, Kafka, Elasticsearch | Scheduled report export to object storage or a webhook; audit-evidence export; OTLP trace export (see 22.8) |
| A separate administrator sign-in-log page, and the attempted account in failed sign-in records | Filter Operation audit by 「Authentication + Client error」 (see 22.10) |
| Shard and sequence detail of audit-integrity issues, and a detail download | Export that interval's audit-evidence CSV and compare; contact the platform side when it is abnormal (see 22.6) |
| Tenant-side enablement of audit archive | Archive storage is deploy configuration, connected on the platform side (see 22.6) |
Previous: 21. Problem diagnosis and handling · Next: 23. Platform runtime and day-to-day maintenance
21. Problem diagnosis and handling
Full-length chapter. Content is checked against the 2026.10 mainline code and the live console; menus and features depend on the current license, account permissions, and delivered environment.
23. Platform runtime and day-to-day maintenance
Full-length chapter. Content is checked against the 2026.10 mainline code and the live console; menus and features depend on the current license, account permissions, and delivered environment.