19. Observability entries, data sources, and permission boundaries
Full-length chapter. Content is checked against the 2026.10 mainline code and the live console; menus and features depend on the current license, account permissions, and delivered environment.
Back to overview · Full table of contents · Download full PDF
This chapter: for platform administrators, operations staff, and security auditors. Where observability data comes from, which pages to look at, who can see it; how to read a Trace and stage latency; how to let a client report a call chain over OTLP and join it with gateway records; how to declare a data mapping when reported fields do not follow the standard convention; how capture share and retention policy affect what you can query; and the permission boundary of platform data. Investigating a single request or session is in Chapter 20.
19.1 Observability entries and data sources
Every model call, MCP call, and API-service call that goes through the gateway is recorded automatically. The caller does not need to change. Data is kept in the customer environment and viewed at these entries:
| Entry | Menu path | Main use |
|---|---|---|
| Operations overview | Admin Console › Observability › Operations overview | Overview metrics; Requests, Sessions, Rule hits, Alerts tabs |
| Usage insights | Admin Console › Observability › Usage insights | Automatically identify issues in sessions and give causes and fix suggestions |
| Ingestion settings | Admin Console › Observability › Ingestion settings | 「Unrecognized sources」 and 「Declared mappings」 tabs declare session ID, model, and tool fields for clients that do not follow the standard writing (section 19.4). The 「Session capture」 tab decides whether to keep assistant-reply bodies, and how to attribute sessions to work items |
| MCP Services › Usage | Admin Console › Capabilities › MCP Services › service detail | Tool-call activity of a single MCP service |
| Models › Usage | Admin Console › Models › Models › model detail | A single model's call count, share, and cost across upstreams |
| Model Groups › Usage | Admin Console › Organization & Access › Model Groups › group detail | Status, concurrency, error rate, and per-minute throughput of a single model group |
| Workspace › Insights | Workspace top navigation 「Insights」 | Members view their own sessions and client-reported call chains |
| Operation audit | Admin Console › Audit & compliance › Operation audit | Configuration changes, token issue and revoke, payload access, and similar audit records |
| Alert rules and notification channels | Admin Console › Operations & Troubleshooting › Alert rules | Alert rules, silences, templates, notification channels, and delivery results |
| Runtime monitoring, platform runtime logs | Platform administrator's management console (platform runtime logs: from 「Gateway › Nodes」 into the node detail, click 「View node logs」) | Node and dependency status, egress connectivity, platform events |
Data sources
- Call records: the gateway records every call in full, with no sampling. Contents include actor, access credential, client, model, result, latency segments, tokens, cost, matched rules, and upstream attempts.
- Request and response payloads: the gateway captures four legs — 「Client request」, 「Request to upstream」, 「Upstream response」, 「Response to client」. Whether they are retained and for how long is decided by data-retention settings (section 19.5).
- Rule hits: routing, traffic limits, content guardrails, malicious-source checks, and site-protection policies each request matched.
- Sessions: the gateway chains multi-turn calls by session identifier. Client-reported steps are merged into the same session.
- Client call chains: Spans the client reports over OTLP. Only clients that have reporting enabled have them (section 19.3).
Note
- Call records and metering are not affected by data-retention settings and are always kept in full. Data-retention settings only control payload bodies.
- Observability records are written asynchronously in the gateway and do not block request forwarding. You cannot see the cost of recording itself in the request-detail latency segments.
- Each page shows only data in the current account's permissions and tenant. Roles are assigned in 「Organization & Access」 (Chapter 3).
19.2 Read a Trace and stage latency
When to use this: you need to tell where a call was slow, or confirm whether a step actually went through the gateway.
Procedure
- In 「Operations overview › Requests」, search by request ID and open that call. The request ID is from the
x-request-idresponse header; the Trace ID is fromx-trace-id. - Switch to the 「Latency & outcome」 tab and read the fixed segments: ingress processing, queue, gateway processing, failure retry, upstream (streaming includes generation), gateway latency, gateway total / end-to-end, time to first token.
- To see tool calls and retrieval steps inside the client, open Workspace top navigation 「Insights」 and enter that Trace detail.
- Trace detail provides tree, timeline, graph, and log views. Select a Span; the right shows model, provider, duration, end reason, input/output, attributes, and events.
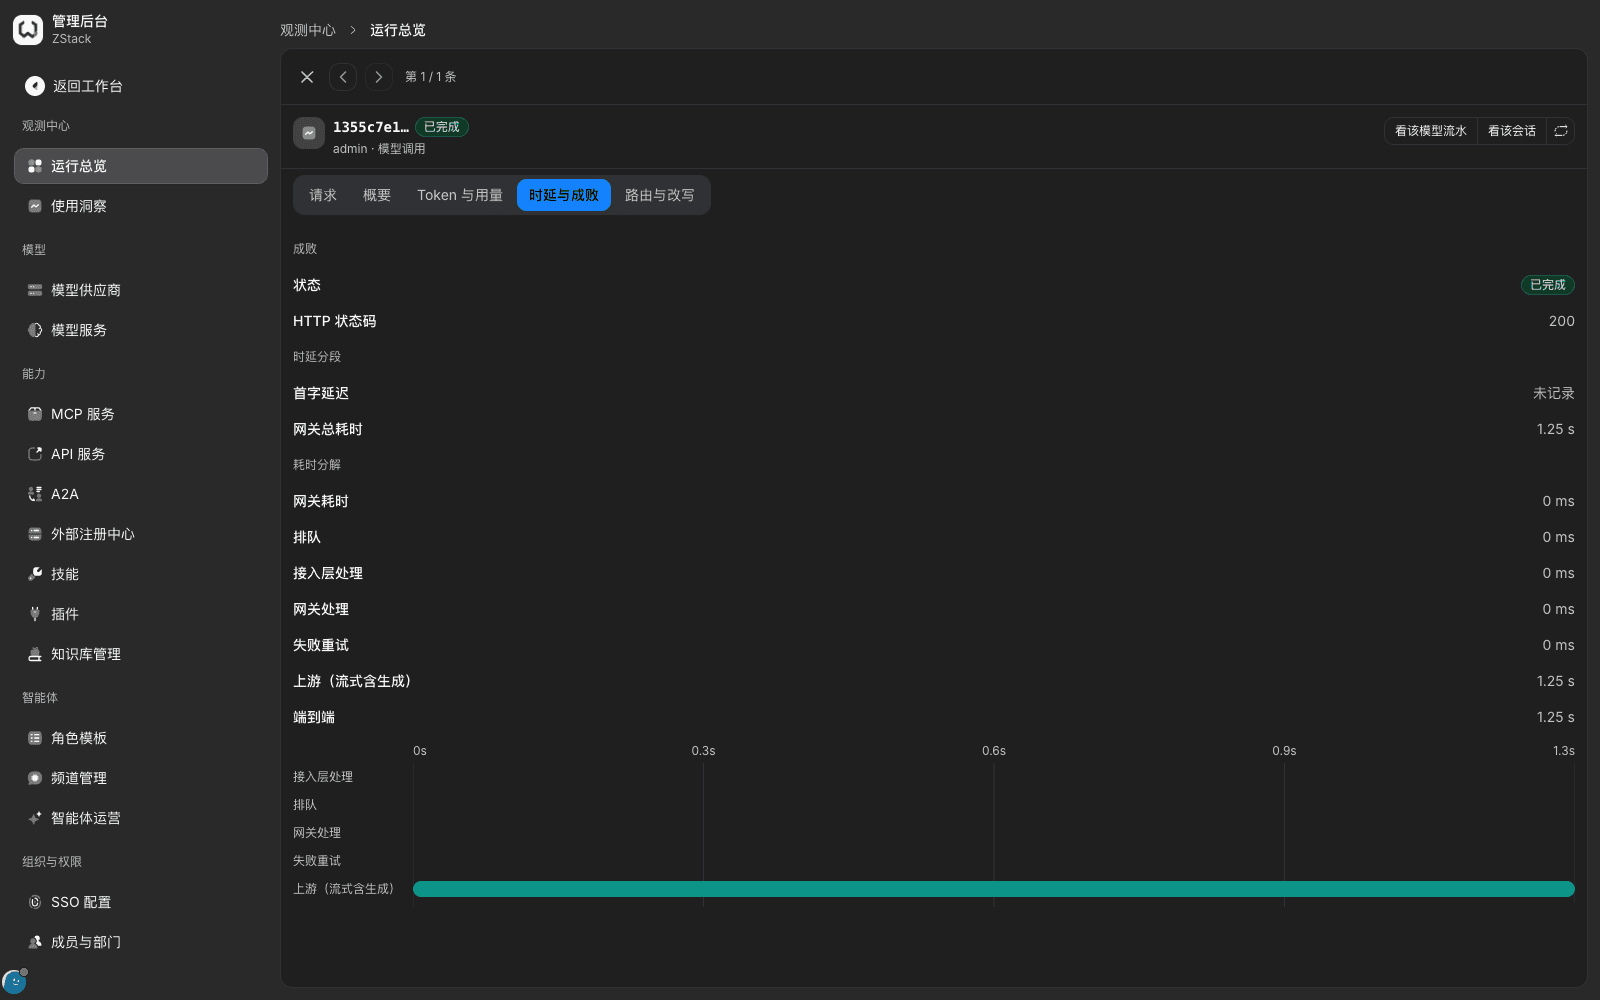
What you will see
- Each segment is recorded as an integer millisecond. Cost under 1 millisecond shows as 0 ms.
- 「Time to first token」 on a non-streaming call shows 「Not recorded」.
- 「Latency」 of each attempt in 「Routing & changes › Upstream attempts」 is counted until the upstream returns response headers. The 「Upstream」 segment is counted until the whole response body is read. The two mean different things.
- The gateway-side Span in Trace detail is one
llm.attempt. Attributes expand genAiSystem, genAiRequestModel, genAiInputTokens, durationMs, selfTimeMs, and similar. 「Capture scope」 marks whether a downstream span was recognized.
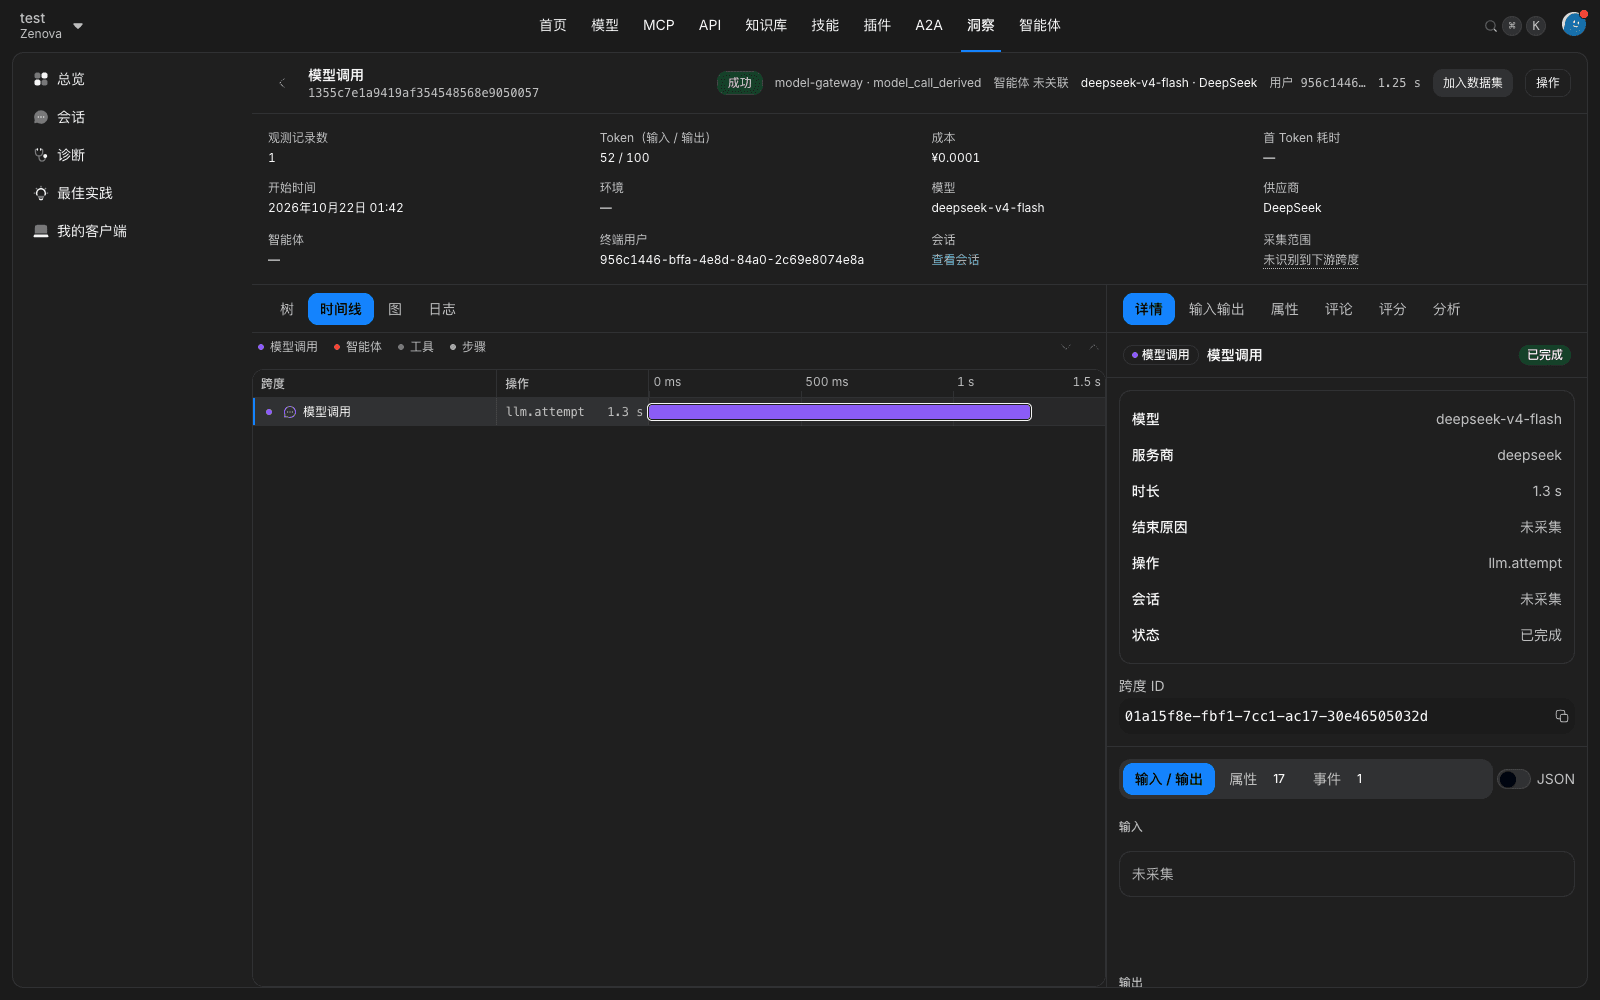
Note
- The gateway side only provides fixed latency segments. There is no Span breakdown by model, tool, retrieval, or governance. Span-level breakdown exists only for data the client reports on its own.
- Spans the gateway itself produces do not capture input or output. The right shows 「Not captured」. To see payloads, go back to the request-detail 「Request」 tab.
- A client's Span may arrive later than the gateway Span. If a just-happened call has no downstream span, open it again later.
- The page may prompt 「Content failed to load, please retry」. Click 「Retry」.
19.3 Join a client call chain with OTLP
When to use this: you need to put the client's internal tool calls, retrieval, and similar steps on the same call chain as the gateway's model call.
Prerequisites
- The client can send OTLP/HTTP (JSON or Protobuf) traces.
- The member has created an API key for that client in the workspace.
Procedure
- In Workspace 「Models」, open the target model and click 「Get API key」.
- In 「Attach to which client」, choose 「New client」, fill a client name, set type to 「Generic OTLP」, and click 「Create」.
- The dialog gives the API key and the reporting configuration together. The reporting configuration looks like:
POST https://<网关地址>/api/v1/public/otel/v1/traces
Authorization: Basic <上报密钥>
The reporting key is shown only once. Save it into the client configuration immediately.
4. When the client calls a model, send a W3C traceparent in the request headers so the gateway call and the client Span use the same Trace ID:
traceparent: 00-<32 位十六进制 Trace ID>-<16 位十六进制父 Span ID>-01- The client reports local tool-call, retrieval, and similar Spans to the address in step 3 under the same Trace ID.
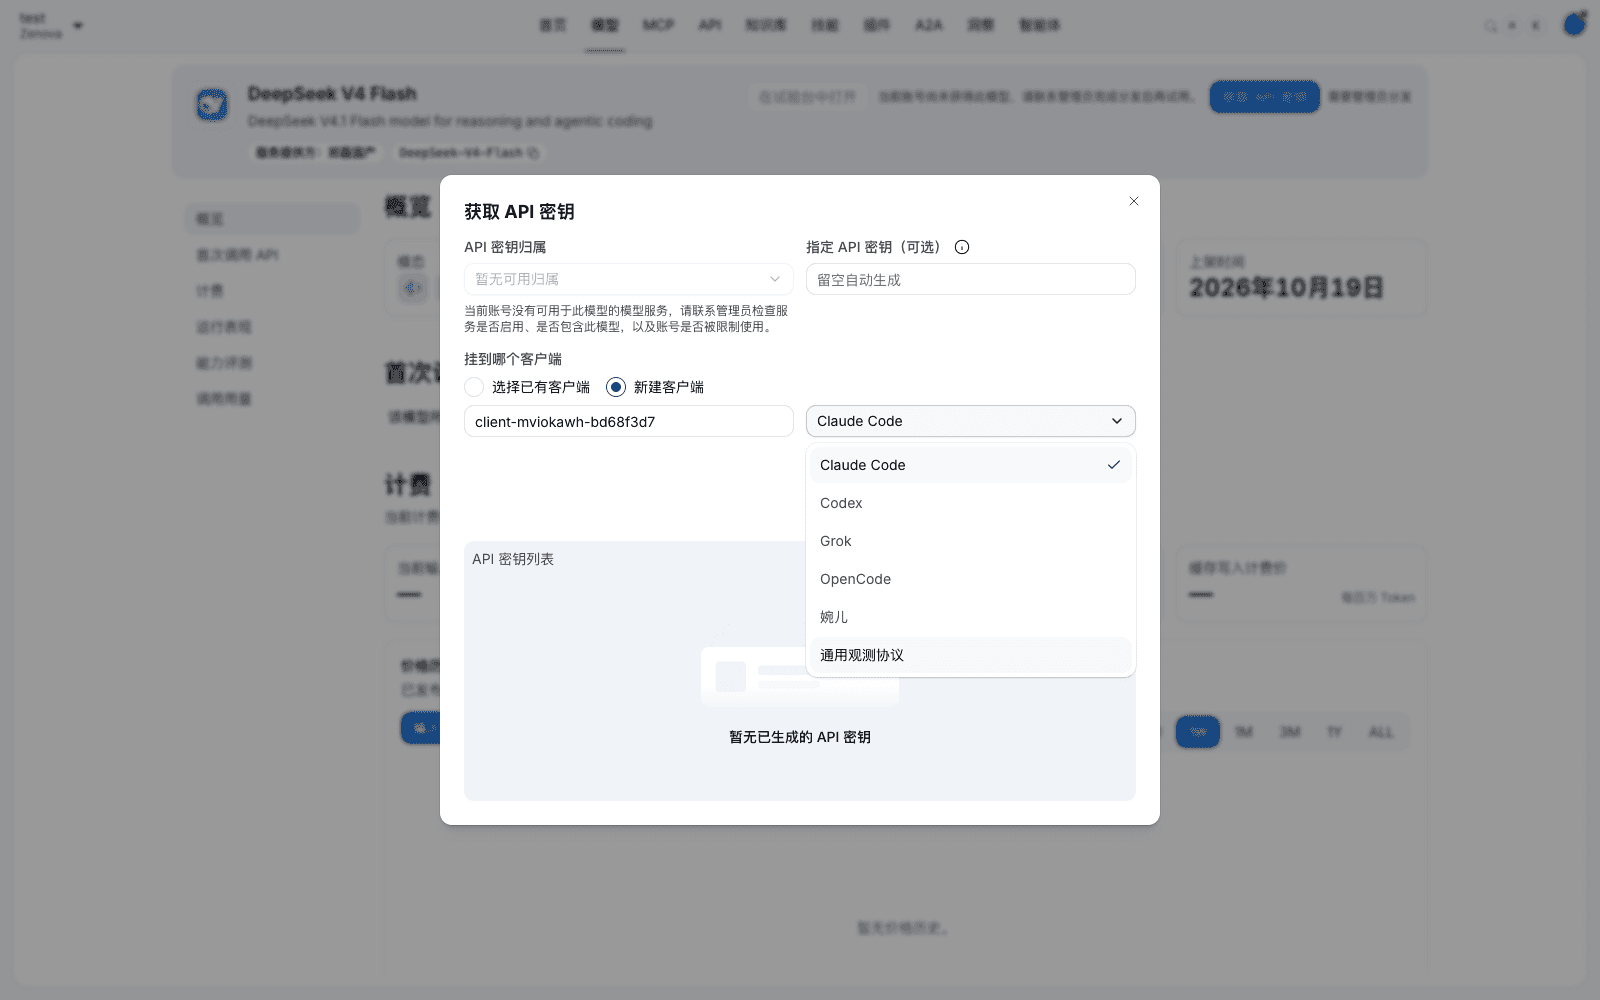
What you will see
- The gateway
x-trace-idresponse header equals the Trace ID carried intraceparent. When there is notraceparent, the gateway generates one and returns it inx-trace-id. - 「Trace ID」 in the request-detail 「Summary」 is the same as that Trace ID.
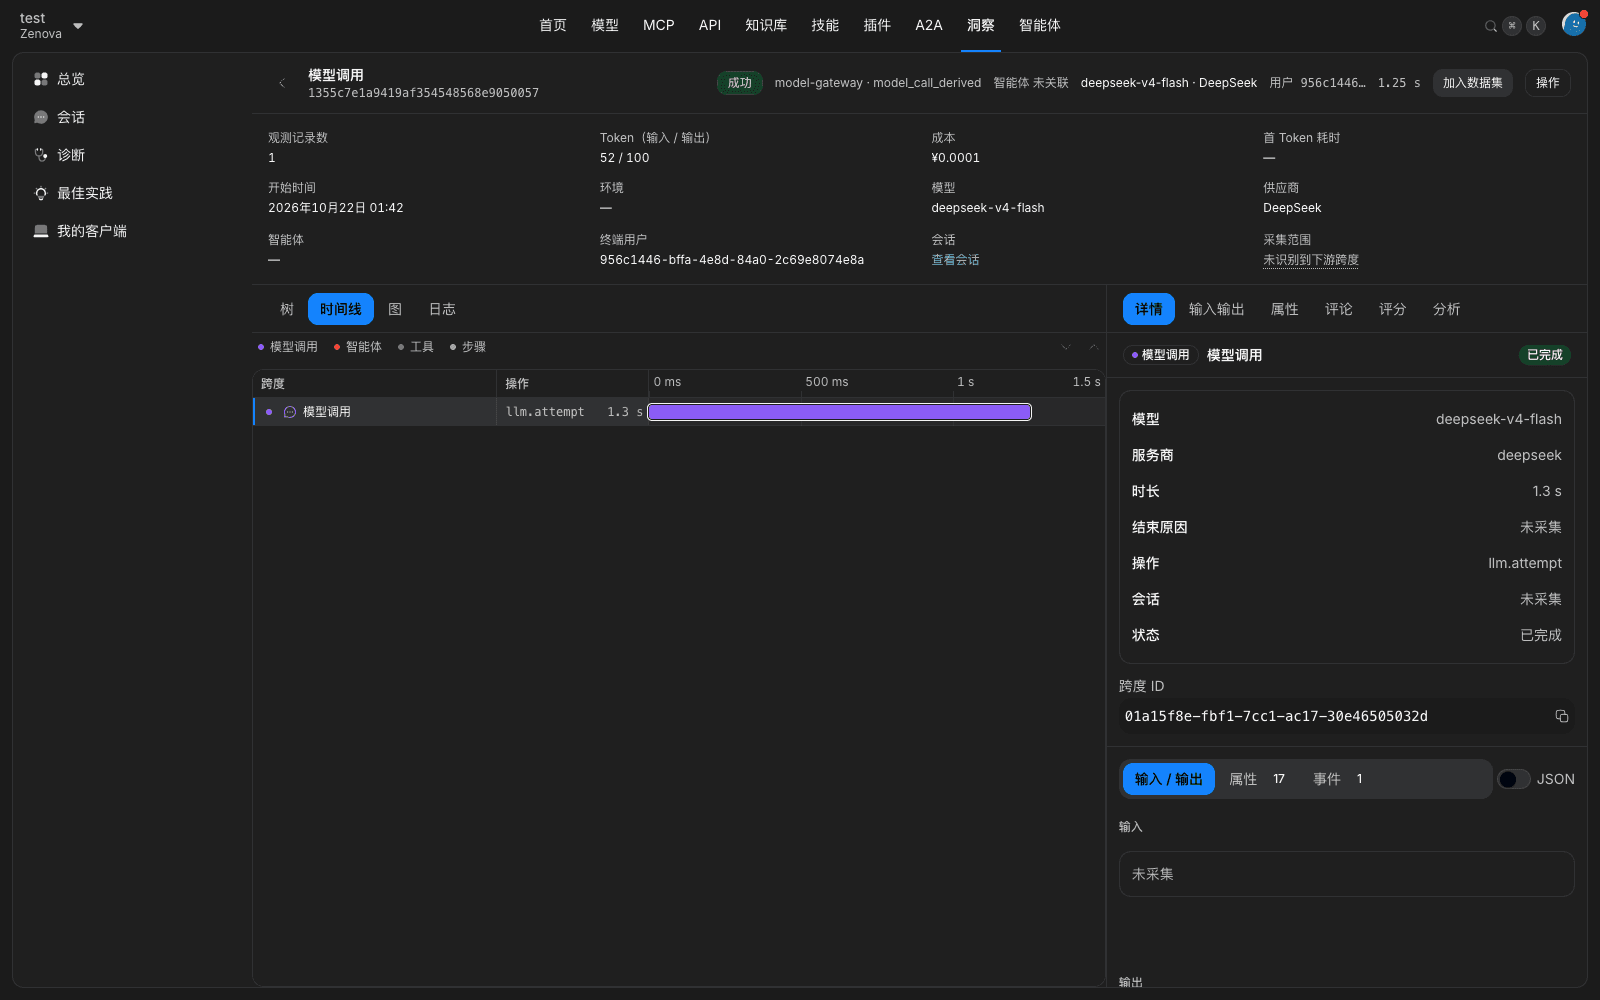
- After reporting succeeds, gateway-side and client-side Spans appear on the same call chain in Trace detail.
Note
- The reporting key and the API key are two credentials. The former can only report observability data; it cannot call a model. Deleting the client invalidates the reporting key with it.
- If the client does not send
traceparent, the two sides belong to different Traces and can only be associated by time and session. - The client's reporting sample rate is decided by the client's own OpenTelemetry SDK configuration. The platform shows received Spans as-is.
- The reporting API does not accept unauthenticated requests. Only a traces reporting path is provided; there is no OTLP metrics reporting path.
Common frameworks
- AgentScope 1.x / 2.x and the openJiuwen observability chain report by the OpenTelemetry generative-AI convention. Connect them and model calls, tool calls, and sessions are recognized, with no extra configuration.
- AgentScope 1.x: the session ID is taken from
agentscope.init(run_id=…). Every session in the same process shares that ID. To separate by session, initialize each session with its ownrun_id; or upgrade to 2.x, whereAgentState.session_idprovides the session ID. - openJiuwen single-agent mode: every conversation turn must be wrapped with
open_agent_run_span/close_agent_run_span, or the framework reports no steps. - openJiuwen's tracer_otel chain: session ID and tool arguments/results are not in the standard locations. Declare a data mapping on 「Ingestion settings」 (section 19.4).
19.4 Declare a data mapping
When to use this: the client is already connected as in section 19.3, but reported steps do not fill session ID, model, or tool fields by the standard convention, so session, usage, or body display is incomplete. A data mapping maps customer-owned attributes on those steps to fields the platform recognizes. The client does not need to change code.
Prerequisites
- The account is a tenant administrator. Data mapping is tenant-level configuration. It applies to all reported data this tenant receives, independent of the connected client and the reporting key.
- There is already reported data from that source. If there is none yet, prepare an OTLP JSON sample the client exported.
Procedure
Take the openJiuwen tracer_otel chain as the example: service name risk-agent, reporting component openjiuwen.tracer.otel, session ID in attribute openjiuwen.session_id, tool arguments and results in openjiuwen.agent.inputs and openjiuwen.agent.outputs.
- Open 「Admin Console › Observability › Ingestion settings」. When recognition rate is low, a prompt also appears at the top of 「Operations overview」. Click 「Configure data mapping」 in it to enter the same page.
- In 「Unrecognized sources」, find the
risk-agent · openjiuwen.tracer.otelrow. That row lists last-24-hour step count and recognition rate. Click 「New mapping」 on that row. 「Applies to」 is filled from that source automatically (reporting component equalsopenjiuwen.tracer.otel). You can also click 「New mapping」 at the top right of the page and start from blank. - Fill a mapping name, for example 「Risk agent」. In 「Applies to」, click 「+ condition」 to narrow further by service name, reporting component, or attribute. Only steps that meet every condition at once use this mapping. Under the block, last-24-hour matched step count and source-service count are shown.
- In the 「Session」 block, set 「Session ID from」 to
openjiuwen.session_id. The dropdown lists only attributes that actually appeared, with a sample value and coverage share next to them. 「Steps on the same call chain that have no session ID inherit this chain's session ID」 is ticked by default. Set 「User ID from」 as needed; leave 「Not set」 if you do not need it. - In 「Step groups」, select the
execute_toolgroup. On the right, set 「Name match」 to 「Starts with」execute_tool, 「Type」 to 「Tool call」, then choose a value source for each field: 「Tool name」gen_ai.tool.name, 「Tool arguments」openjiuwen.agent.inputs, 「Tool result」openjiuwen.agent.outputs. Fields with * must be filled. Which fields each type includes follows what the page lists. - If there is no reported data yet, click 「Paste sample」 at the top right, paste an OTLP JSON sample, and complete steps 4 and 5 from the steps in the sample.
- Click 「Preview」 and check the recognition rate and each group's change. When it is correct, click 「Save and enable」. To not enable yet, click 「Save」, then enable it in the list later.
What you will see
- Preview gives the recognition rate and the share of 「steps with a session ID」 before and after save (for example 12% → 100%), and each group changing from 「Unrecognized」 or 「Partial」 to 「Recognized」. Groups still not fully recognized list missing fields; you can go back and keep editing.
- If some steps have already been taken over by a mapping ranked earlier, preview names that mapping and the step count, and provides 「Move to front」.
- After enable, later received data shows turns, model, tokens, and body in 「Operations overview」, 「Usage insights」, and session detail.
- Hit count and recognition rate of that mapping in 「Declared mappings」 keep updating. That source's recognition rate rises, and at 100% it no longer appears in 「Unrecognized sources」.
Note
- A step uses only the first mapping that matches, in order. In 「Declared mappings」, adjust order with 「Move up」 and 「Move down」 on the row menu. A wide mapping should sit after a narrow one.
- A mapping applies only to data received after save. Data already stored is not recomputed.
- Steps already recognized by the standard convention need no configuration. Undeclared groups are still recognized by the platform's built-in rules.
- Attributes declared as body are treated as body, and still follow data-retention settings (section 19.5).
- Creating, changing, enabling/disabling, reordering, and deleting a mapping are all written to Operation audit.
- Recognition rate is a last-24-hour weighted computation over every step of every group.
19.5 Capture share and data retention
Data-retention settings decide how much payload body later calls leave, and for how long. They do not affect the call itself, and they do not affect call records, tokens, or billing.
Prerequisites: the account is a tenant administrator. Data-retention settings are tenant-level global configuration. After save they apply to later calls of every member. Change them in a change window.
Procedure
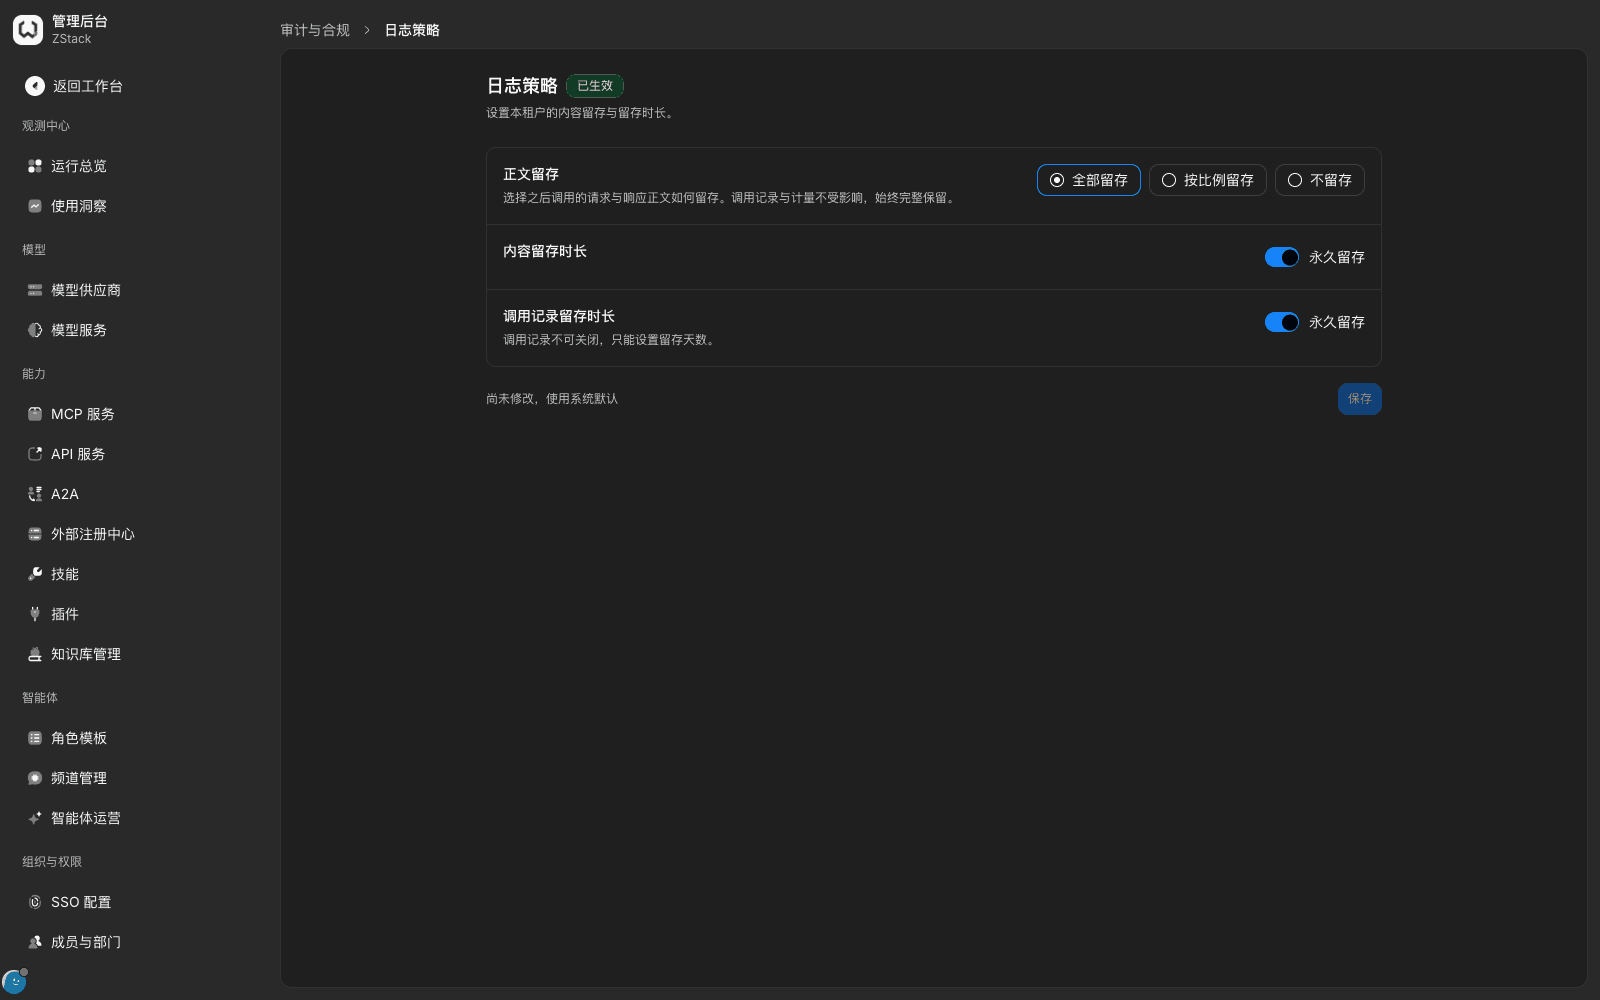
- Open 「Admin Console › System Settings › Global settings › 「Data retention」 tab」.
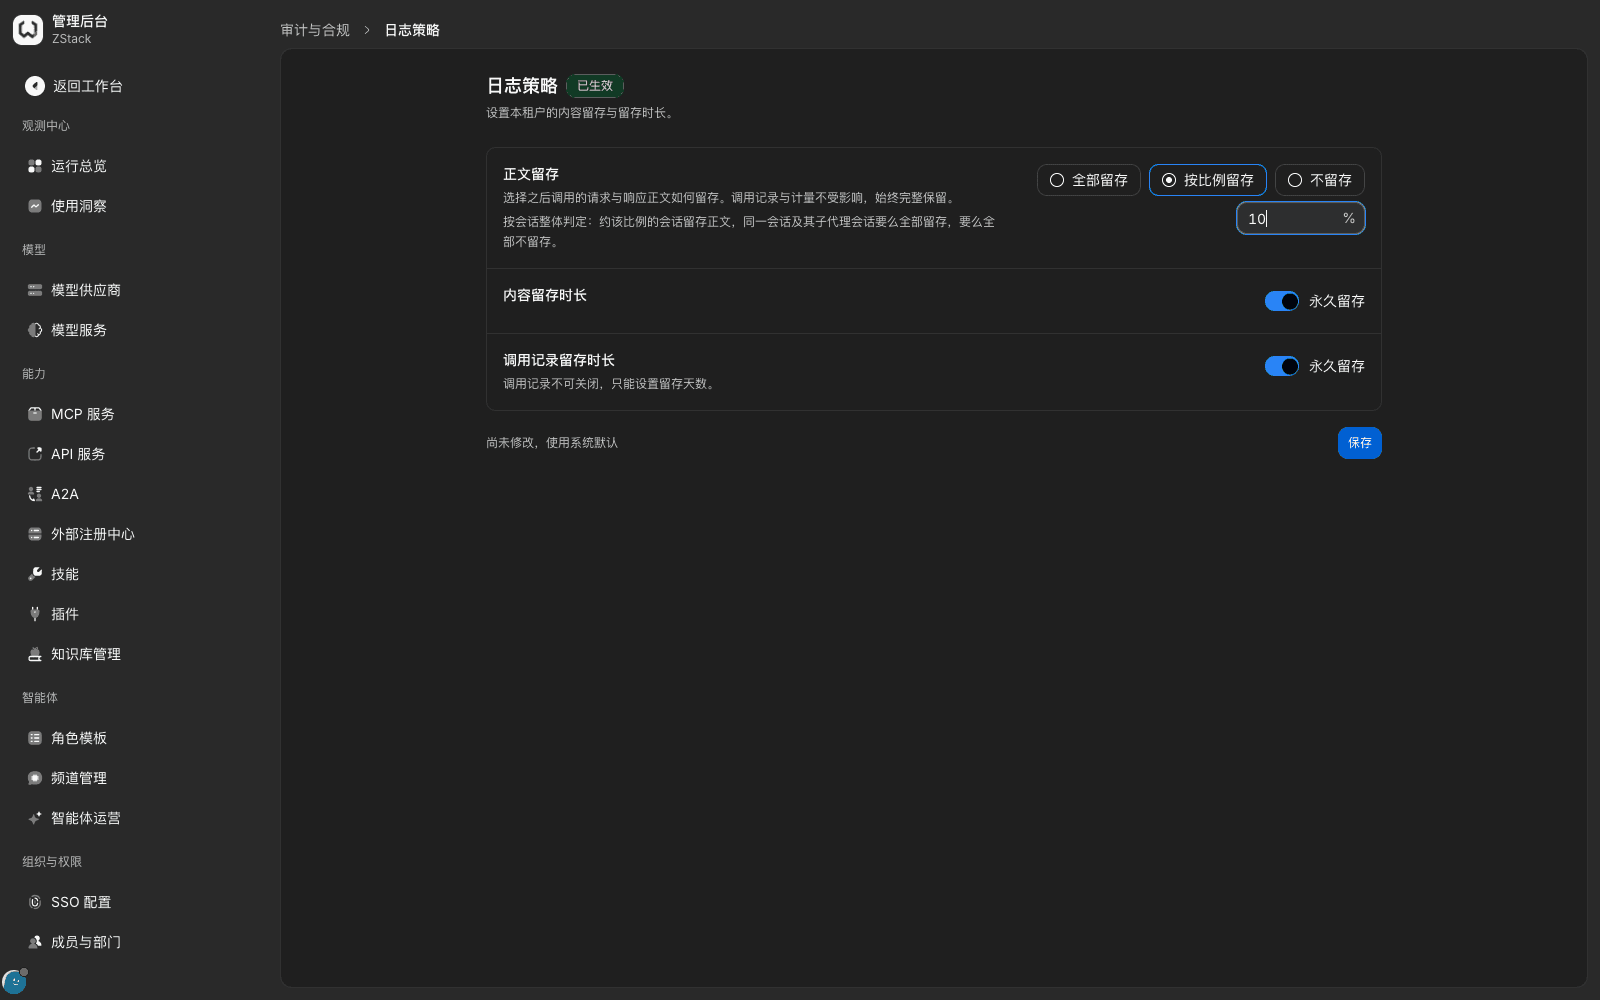
- In 「Body retention」, choose: Retain all (default), Retain a share, Do not retain. When you choose 「Retain a share」, fill a percentage in 「Retention share」.
- In 「Content retention duration」, fill days, or turn on 「Retain forever」.
- In 「Call record retention duration」, fill days, or turn on 「Retain forever」. Call records cannot be turned off; you can only set retention days.
- Click 「Save」.
| Field | Notes | Values |
|---|---|---|
| Body retention | How later calls' request and response bodies are retained | Retain all (default) / Retain a share / Do not retain |
| Retention share | Judged per session as a whole: about that share of sessions retain the body. A session and its sub-agent sessions are either all retained or all not retained | Percentage |
| Content retention duration | How long payload bodies are kept | Days, or retain forever |
| Call record retention duration | How long call records are kept | Days, or retain forever (default) |
Effect on query results
| Situation | What you see in the request detail |
|---|---|
| This session was not sampled to retain the body | The payload area prompts 「Payload not retained under data-retention settings」. Latency, tokens, cost, and matched rules are still queryable |
| The body exceeded content retention | Prompts that the payload exceeded retention and has been cleaned |
| The call record exceeded retention | That call no longer appears in the list |
| Retained normally | 「Retention」 in 「Summary」 shows the current policy |
Note
- Retention share affects only the body. When you retain a share, usage, cost, success rate, and similar statistics still cover every call. You do not need to scale them by the share.
- After you shorten retention, overdue bodies are cleaned and cannot be recovered. Confirm audit and compliance requirements before you shorten.
- Session diagnosis depends on session content. The lower the body-retention share, the fewer sessions diagnosis can cover.
- When the page prompts 「Not modified yet, using the system default」, the current values are not a configuration an administrator has saved.
19.6 Archive and integrity verification
When to use this: you need to prove audit records were not tampered with, or you need to keep audit data long term.
Procedure
- Open 「Admin Console › Audit & compliance › Operation audit」.
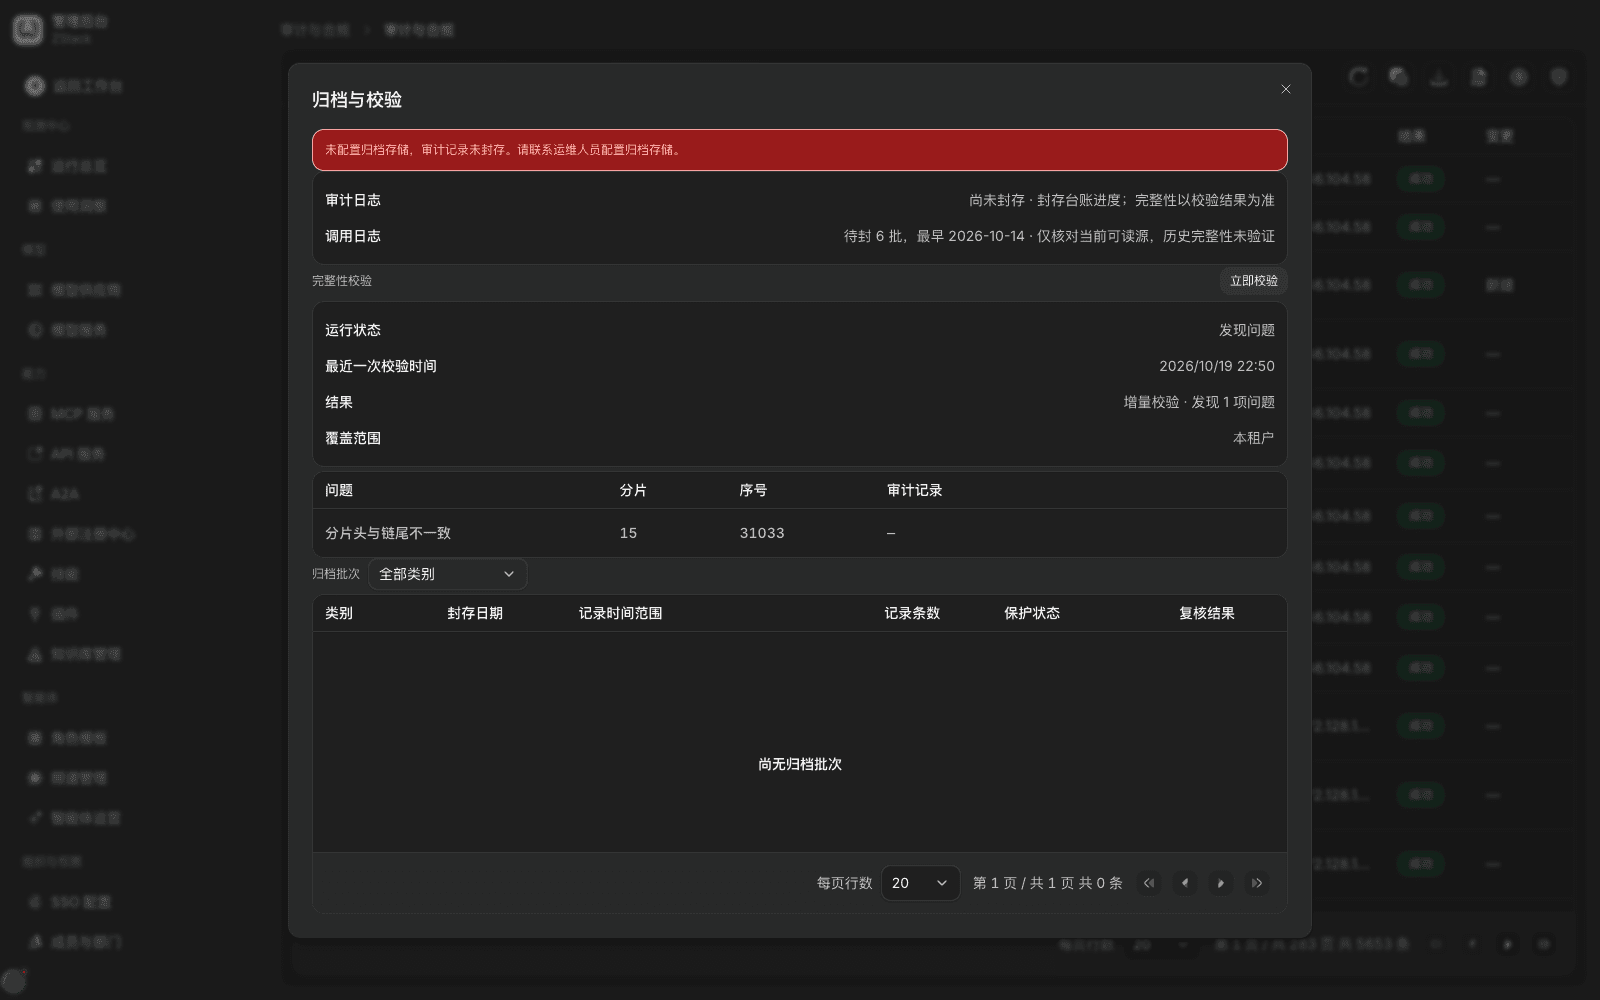
- Click 「Archive and verification」 and look at the sealing progress of audit logs and call logs.
- Read the 「Integrity verification」 block: running status, last verification time, result, coverage, and issue details.
- To verify immediately, click 「Verify now」. Archive batches are in the list below.
What you will see
- When archive storage is not configured, the dialog top prompts 「Archive storage is not configured; audit records are not sealed. Ask operations to configure archive storage.」
- The 「Call logs」 row gives pending-seal batch count and the earliest pending-seal date.
- 「Integrity verification」 gives running status, last verification time, and issue details (for example shard header and chain tail disagree, shard sequence).
- The 「Archive batches」 list is empty when there is no batch yet.
Note
- Archive storage is deploy configuration, completed by operations on the platform side. The tenant Admin Console only views and runs integrity verification by hand.
- When integrity verification finds an issue, record the shard and sequence in the issue details first, then contact the platform side to investigate.
19.7 Permission boundary of platform data
Roles and visible range
- A tenant administrator can see all observability data and configuration items of this tenant. 「Ingestion settings」 is open only to tenant administrators.
- Operations, finance, and audit roles see only the corresponding panels for their duties. A finance role usually sees only cost metrics and rankings. An operations role sees only requests they started.
- A member in the workspace can see only their own data. Traces in 「Insights」 also cover only calls they started.
- Platform-level pages (Runtime monitoring, platform runtime logs) are open only to platform administrators. A tenant administrator who visits those addresses is redirected back to 「Operations overview」. That is expected.
Data-protection measures
- Credentials in request headers are stripped at capture. The page shows 「Redacted · length N」, not the original value.
- MCP tokens in activity records show only the fingerprint prefix, never the full value.
- Every read of a payload body or a diff is written to the audit log.
- Export-class operations (Report export, report export) are recorded in Operation audit.
Agree with the business before you connect: which inputs and outputs may keep the original text, how to redact sensitive data and internal addresses, the range each role can view, and the retention of export and archive. 「Already redacted」 should be proved with real payload samples, not judged only from a configuration switch.
19.8 Alerts and notification channels
When to use this: you want a notification when a policy blocks a lot, a rule execution errors, failover becomes frequent, or the model-call failure rate rises.
Procedure
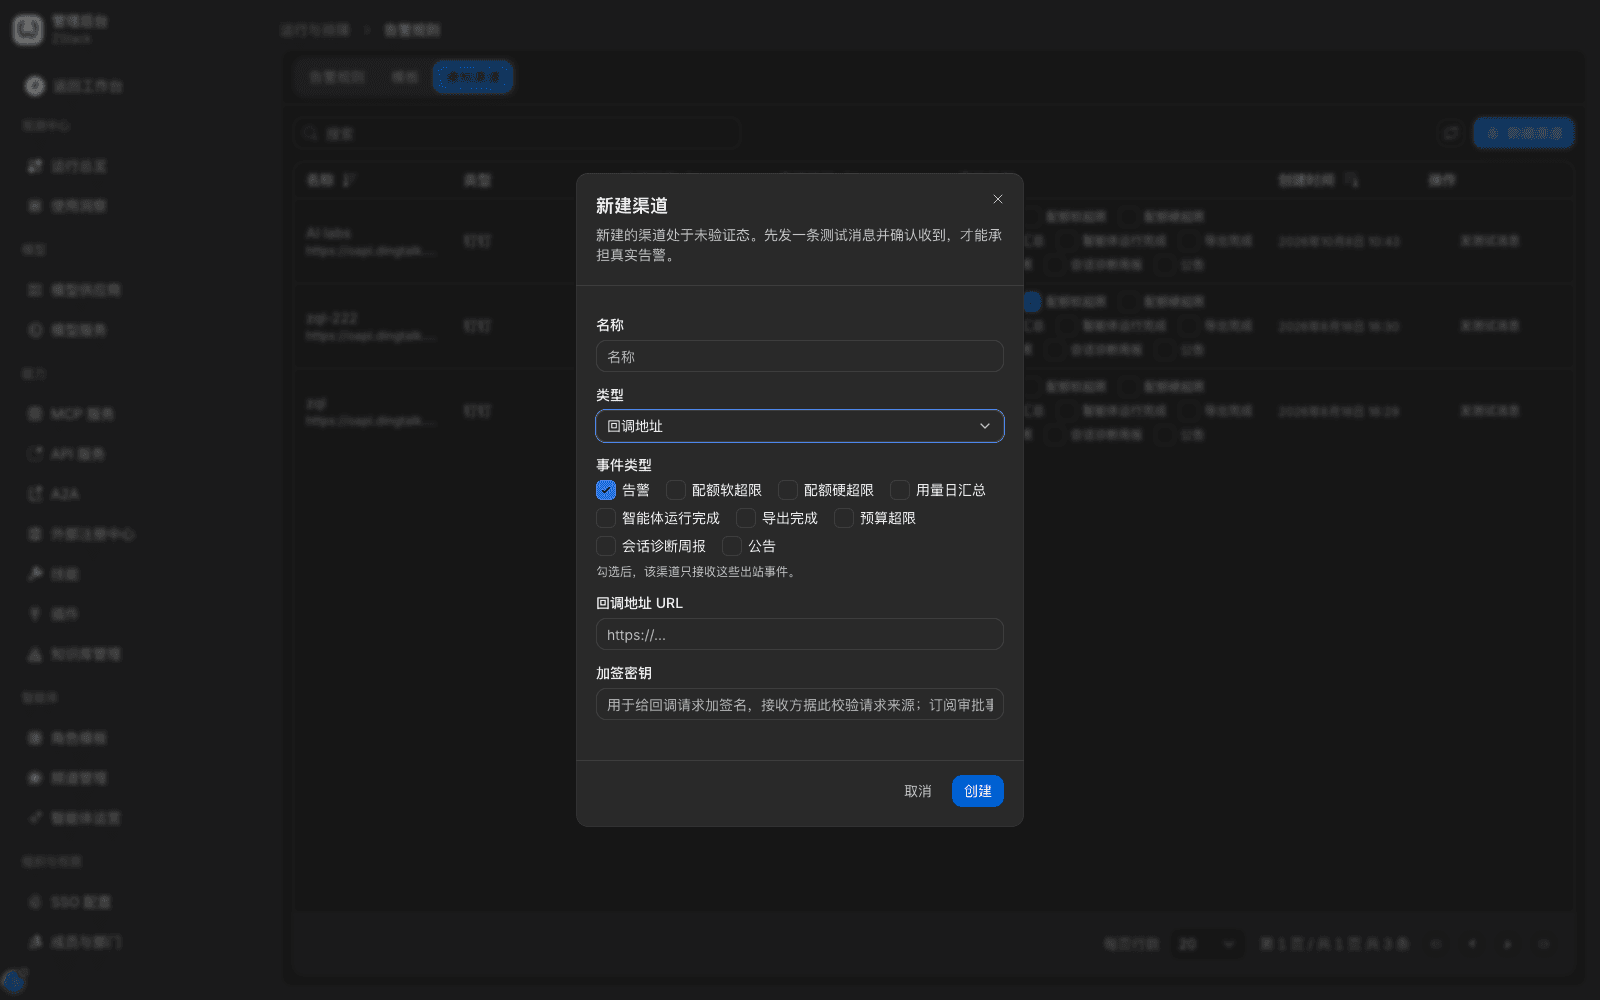
- Open 「Admin Console › Operations & Troubleshooting › Alert rules」, switch to the 「Notification channels」 tab, click 「Add channel」, fill a name, choose a type (DingTalk / Feishu / webhook / WeCom / email), tick the event types this channel receives, then fill the address. DingTalk and webhook can fill a signing secret.
- In that new channel row's 「⋯」 menu, click 「Send test message」. After the receiver confirms it arrived, click 「Confirm receipt」 in the same menu. Verification status becomes 「Verified」.
- Back on the 「Alert rules」 tab, click 「Add rule」, choose a metric (for example 「Policy-block ratio」, 「Policy execution errors」, 「Model-service attempt failure rate」), set aggregation, stats window, comparison, threshold, duration, severity, and notification channels, then click 「Create」 (section 22.3).
- Built-in alerts (for example 「A guardrail blocked content once」) can only be turned on/off and assigned notification channels: in that row's 「More」 menu, click 「Choose channels」, then turn on 「Enable」.
What you will see
- The channel list gives name (masked address underneath), type, verification status, last delivery (time and result), event types, and created time.
- When delivery fails, 「Last delivery」 gives the reason, for example 「Network unreachable」.
- There are nine event types: Alerts, quota soft over, quota hard over, daily usage summary, agent run completed, export completed, budget over, weekly session-diagnosis report, announcement. 「Alerts」 is ticked by default.
Note
- A rule's 「Notification channels」 lists only channels that are enabled, verified, and subscribed to the 「Alerts」 event.
- For a ratio metric (such as 「Policy-block ratio」), fill the threshold as a decimal between 0 and 1, for example 0.2 for 20%.
- Alert rules apply only to this tenant.
Capability notes
| Capability not provided | What to do instead |
|---|---|
| Span-level breakdown of a single gateway call (model, tool, retrieval, governance Spans one by one) | On the gateway side, use the fixed segments of 「Latency & outcome」. Span-level breakdown is reported by the client over OTLP (section 19.3) |
| Configure trace sample rate on the page | Platform trace sampling is set with a deploy environment variable. Gateway call records are always full |
| Export directly to Zipkin, Jaeger, SkyWalking | Export to the customer's own OTLP Collector, which then forwards. The export address is deploy configuration |
| Turn off call records | Call records cannot be turned off; you can only set retention days. Bodies can be retained by share or not retained (section 19.5) |
| Custom access-log field format, access-log sampling, real-time shipping to Kafka / Elasticsearch / syslog | Use 「Export CSV」 on the 「Requests」 tab (fixed fields), scheduled Report export to object storage or a webhook, or OTLP trace export (section 19.3, Chapter 20) |
| Log-keyword alerts | Add a rule in Alert rules on metrics such as 「Gateway blocks」, 「Policy blocks」, 「Policy execution errors」. Platform runtime logs (a platform administrator enters from the node detail 「View node logs」) only support level filter and keyword search |
| View metric-scrape endpoints and credentials on the tenant console | Follow the customer integration document to configure Prometheus scrape of /ops/metrics/{service} (one job per four services; gateway nodes also include this tenant's call stats). Outbound export of traces and logs is provided as needed on the 「Integrations and export」 page. The current release provides a built-in Sentry integration |
| View container, host, and dependency status on the tenant console, or restart a component | A platform-console capability for platform administrators. Node and component status and platform runtime logs should be provided by platform-side operations |
| Run outbound-path diagnosis on the tenant console | A platform-administrator capability. A tenant administrator who hits an outbound issue contacts platform-side operations |
| Console configuration of log-shipping format and sampling policy | When you need to connect an in-house log platform, implement it indirectly with scheduled Report export to object storage or a webhook (section 19.8, section 18.2) |
Previous: 18. Usage and cost analysis · Next: 20. Gateway requests, sessions, and root-cause location
18. Usage and cost analysis
Full-length chapter. Content is checked against the 2026.10 mainline code and the live console; menus and features depend on the current license, account permissions, and delivered environment.
20. Gateway requests, sessions, and root-cause location
Full-length chapter. Content is checked against the 2026.10 mainline code and the live console; menus and features depend on the current license, account permissions, and delivered environment.